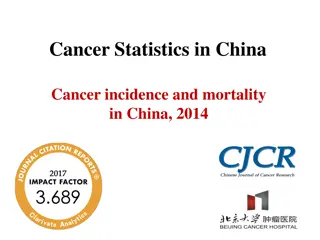
Overview of Tea Production and Marketing in China
The 21st session of FAO-IGG on Tea discussed the current situation of tea production and marketing in China, highlighting the concentration of production in advantageous areas. In 2013, specific provinces accounted for a significant portion of national tea output. The industry has seen increasing area, production, and profits with a rise in the gross output value of the Chinese tea industry. The integral growth of six major teas shows a shift in proportions, with some types growing while others remain stable. Structural changes in Chinese teas have been observed from 2010 to 2013.

Download Presentation

Please find below an Image/Link to download the presentation.
The content on the website is provided AS IS for your information and personal use only. It may not be sold, licensed, or shared on other websites without obtaining consent from the author. Download presentation by click this link. If you encounter any issues during the download, it is possible that the publisher has removed the file from their server.
E N D
Presentation Transcript
The 21 Session of FAO-IGG on Tea Current Situation of Tea Production and Marketing in China Prof. Lin Zhi Tea Research Institute, CAAS
1. Tea Production in China (1) Production concentrated in the advantageous areas
The Distribution of Chinese Tea Production in 2013 Total output Ten thousand tons Area planted(Ten thousand hectares) 45 35 15.80% 17.46% Output 40 30 35 25 30 20 25 20 15 15 10 10 5 5 0 0 Yunnan Guizhou Sichuan Hubei Fujian Zhejiang Anhui Henan Hunan Shanxi Chongqing In 2013, the cultivated area and the production of tea in these 11 provinces together accounted for 88.04% and 88.32% of the national total, respectively.
1. Tea Production in China (2) Increasing area, production and profits Total area Ten thousand hectares Total output Ten thousand tons 300 With an average annual growth rate 6.6% and 7% 250 258 200 197 189 150 149 100 50 0 2010 2011 2012 2013
Gross output value of Chinese tea industry and its share in total agricultural gross output value Output value of tea Proportion of agricultural 1400 Hundred million Proportion 2.00% With an average annual growth rate 14.4% and 13.1% 1.94% 1.95% 1200 1106 1.90% 1000 1.83% 1.85% 800 1.80% 600 1.75% 400 1.70% 200 1.65% 0 1.60% 2010 2011 2012 2013
1. Tea Production in China (3) The integral growth of six major teas While the total production continues growing, the proportions of green tea and oolong tea have stayed at the same level or slightly declined. By contrast, the proportions of brick tea, black tea, white tea and yellow tea are continually on the rise, taking on a look of six major teas developing integrally.
The structural change of Chinese teas (Yield ratio): 2010-2013 80.00% 70% 70.00% 66% In 2013, the productions of green tea, black tea, brick tea, oolong tea, white tea and yellow tea were 1.249 million tons, 0.198 million tons, 0.197 million tons, 0.229 million tons, 0.011 million tons and 2.253 thousand tons, respectively, with year-on-year growth rates of 5%, 14.2%, 16%, 3.6%, 19.8% and 10.5% respectively. 60.00% 50.00% 5% Green tea Black tea 40.00% Oolong tea Brick tea 30.00% 20.00% 12% 10.00% 10% 0.00% 2010 2011 2012 2013
1. Tea Production in China (4) Improving product quality Chinese government takes great efforts to invest in the standardization of tea plantation, pest control and green prevention-control technology. In the procedure of tea processing, marketing threshold was raised for tea firms to improve production conditions according to the QS standard criteria.
The proportions of clonal tea area, organic tea area and pollution-free tea in 2013 5.91% 0.152 million hectares, growth rate 6.4% 1.64 million hectares, annual growth rate 8.6% 63.63%
2. Tea Marketing in China (1) Exploring urban and rural market to increase domestic sales China s consumption quantity of tea reached 1.235 million tons in 2013 with an annual average tea consumption growth rate of 5%(FAO data). The population of Chinese tea consumers was 4.68 billion, 36% of the total. Among them, the population of urban consumers and rural consumers were 2.54 billion and 2.14 billion, respectively (Guan Xi , 2011).
Per capita consumption of tea in selected countries Ranking only the 20thin the world China still has lots of space to enhance its domestic consumption quantity of tea.
2. Tea Marketing in China (2) Consolidating international market to increase export quantity In recent years, the export quantity of Chinese tea has been growing slightly with fluctuations, and the export value and price have continued rising too.
Chinas export quantity and value of tea: 2010-2013
World exports of tea: 2003 VS. 2012 The share of Chinese tea export quantity wasn t high compared with the total world export, the number in 2012 (i.e., 18%) was even lower than that of 2003.
3. Tea Marketing in China (3) The balancing of production and marketing From 2001 to 2011, the annual average growth rate of tea consumption in China was 8.86%; on the other hand, the annual average growth rate of tea production was 8.77%.
Chinas tea production and marketing: 2010-2013 2010 2011 2012 2013 Total thousand tons) Total thousand tons) Yield (10 147.51 162.32 177.43 189.00 Sales (10 146.36 155.51 161.85 171.08 Since 2010, along with the increase of new tea plantations, China s tea production has been growing rapidly, even more than tea consumption. Considering consumption inventory, processing losses and other factors, production and marketing keep in balance basically.