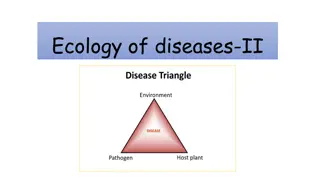
Understanding Grazing and Regulation in Ecosystems

Exploring the dynamics of grazing and regulation in ecosystems, this content delves into the interaction between grazers and plants. Contrasting top-down versus bottom-up regulation, it discusses how grazers impact plant populations without necessarily killing individuals. By modeling plant-grazer interactions using the Lotka-Volterra model and considering factors like biomass changes and re-growth, a comprehensive understanding of these ecological relationships is achieved.
- Grazing dynamics
- Lotka-Volterra model
- Plant-grazer interactions
- Ecosystem regulation
- Ecological relationships

Uploaded on Sep 11, 2024 | 0 Views
Download Presentation

Please find below an Image/Link to download the presentation.
The content on the website is provided AS IS for your information and personal use only. It may not be sold, licensed, or shared on other websites without obtaining consent from the author. Download presentation by click this link. If you encounter any issues during the download, it is possible that the publisher has removed the file from their server.
E N D
Presentation Transcript
Grazers Generally herbivores Remove tissue from a large number of prey individuals Are rarely lethal What limits grazer population density?
Top down vs. bottom up regulation Top down Bottom up
We have already seen that predators can control prey densities Direct effects Indirect effects
But can plant abundance also control grazer densities? How can we answer this question?
We could apply the Lotka-Volterra model Prey (Plants) Predator (Grazer) dN dP = = rN NP NP qP dt dt is the per capita impact of the predator on the prey is the per capita impact of the prey on the predator q is the predator death rate But this implies that grazers kill prey individuals outright
But by definition, grazers do not kill prey individuals Plant parts differ in nutritional quality, so only some parts are eaten Plant parts differ in levels of chemical defense, so only some parts are eaten
As a result, graze biomass changes, but population density does not After grazing Before grazing
The re-growth of graze biomass should not be logistic 1 0.8 Biomass Regrowth 0.6 0.4 Logistic 0.2 0 re-growth should be more rapid 0 20 40 60 80 100 Time
A reasonable model of plant-grazer interactions A Lotka-Volterra model with the following changes: 1. Prey (plant) biomass changes in response to grazing, but prey (plant) population density does not. 2. Prey (plant) biomass increases in a re-growth rather than logistic fashion. 3. A Type II functional response
What does the model tell us? No Grazers Grazers 5 5 Plant biomass Grazer population density 4 4 Graze biomass 3 3 2 2 1 1 0 0 0 200 400 600 0 200 400 600 Interactions between grazers and plants limit plant biomass Interactions between grazers and plants limit grazer population densities Interactions between grazers and plants lead to stable equilibria, not permanent cycles
A comparison of interactions Grazing Predation Predators can control prey population density Grazers can control plant biomass Prey density can control predator density Plant biomass can control grazer population density Can cause cycles Generally does not cause cycles
Top down vs. bottom up regulation Top down Bottom up Mathematically, both can work But what about real data?
Another look at snowshoe hare cycles Year The strong cyclical nature of this data would seem to be more compatible with top down regulation. However the simple re-growth model considers only graze quantity and ignores graze quality
An alternative hypothesis Hare population density is regulated from the bottom up This bottom up regulation is due to both graze biomass and graze quality Lynx density simply tracks hare density
Interactions between the hare and its food plants Soapberry Bog birch Betula glandulifera Grey willow Salix cinerea Sheperdia canadensis
Evidence for importance of vegetation (Quantity) Pease et. al. 1979 Studied a population of hares in Alberta from the peak of the cycle to its trough (1970-1975) Measured food availability to hares during these years Results showed that in the peak years of 1970 and 1971 food plant biomass was too low to support observed hare population densities
Evidence for importance of vegetation (Quality) Bryant et. al. 1979 Studied the chemical composition of plants used by hares as food Found that secondary shoots (produced after intense hare grazing) had significantly greater concentrations of toxic chemicals that deter feeding by snowshoe hares These results suggested that hare population cycles might be driven by fluctuations in the level of plant defenses
This led to a new hypothesis The bottom up or food shortage hypothesis 1. Hare population density increases, causing increased removal of plant tissues 2. As a result, plant biomass decreases, plant quality decreases, and plants become increasingly well defended with toxic chemicals 3. Consequently, hare population begins to decline due to a shortage of food 4. As hare population density decreases, plant biomass increases and the concentration of toxic chemicals is reduced 5. Lynx do nothing but track the density of the hare population
Comparison of the two hypotheses Which is correct?
Kluane studies (Krebs et. al.) Studied an entire lynx-hare cycle from 1986-1994 in the Canadian Yukon Experimentally manipulated both predation and food supply Followed lynx and hare densities within 1km square enclosures
Design of the Kluane study Food added and Predators excluded 1km Control Food added Control Food added Fertilizer added (by plane!) Predators excluded Fertilizer added Control
Results of the Kluane study Predators excluded Food added Hare density was doubled during peak years Hare density was tripled during peak years Predators excluded & Food added Hare density was increased eleven fold during peak years Both food supply and predators play a role in regulating hare population density
What about other systems? (An example from the diverse mammal community of the Serengeti) Elephant Leopard Cheetah Oribi Serval Black Rhino Hippo Hyenah Impala Lion Zebra Wildabeest Golden Jackal
Predator species differ in the size of prey they consume (Sinclair et. al. 2003. Nature 425:288-290)
Therefore, prey species differ in their # of predators (Sinclair et. al. 2003. Nature 425:288-290)
As a result, some prey species experience more predation (Sinclair et. al. 2003. Nature 425:288-290) Predation limited Oribi Food limited Elephant
Moose on Isle Royale Colonized island around 1890 Initially rapid population increase Experience repeated die offs and population fluctuations
Enter Wolves Arrive on Island in late 1940s
What Regulates Moose Population Growth? Could we use this data to find out?
Before Parvovirus outbreak After Parvovirus outbreak Wilmers, C. et al. 2006 Ecology Letters 9, 383- 389
Summary of wolf moose interactions Prior to 1980, wolves regulated moose population densities Top-down regulation After 1980, moose population densities were regulated by availability of food Bottom-up regulation
Summary: Grazing and Top Down vs. Bottom Up Regulation Interactions between grazers and plants can control both the density of grazers and plants Plant-grazer interactions are less likely to cycle than are predator-prey interactions Mathematical models show that both bottom up and top down population regulation are possible and not mutually exclusive Empirical studies show that prey density is regulated by both predators and food supply. The relative importance of each depends on species, location, and point in time.


")
")


")