Seismic Site Characterization in Metropolitan Vancouver
The Greater Vancouver area faces high seismic risk due to its population density and critical infrastructure. Ground shaking during large earthquakes depends on various factors including the earthquake source, material properties, and site conditions. Efforts are being made to map seismic hazards, update earthquake site responses, and characterize sites in Metropolitan Vancouver to improve hazard assessment and site classification. The application of seismic microzonation maps, seismic soil hazard mapping, and seismic velocities data collection are key components of ongoing projects in the region.

Download Presentation

Please find below an Image/Link to download the presentation.
The content on the website is provided AS IS for your information and personal use only. It may not be sold, licensed, or shared on other websites without obtaining consent from the author. Download presentation by click this link. If you encounter any issues during the download, it is possible that the publisher has removed the file from their server.
E N D
Presentation Transcript
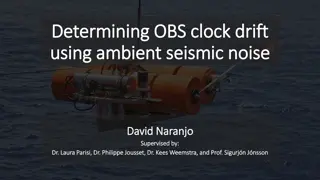
Earthquake Site Characterization in Metropolitan Vancouver Frederick Jackson Supervisor Dr. Sheri Molnar
Greater Vancouver is area of highest seismic risk in Canada Population > 2 million and critical infrastructure Hazard o 3 types of earthquakes o sedimentary basin What will ground shaking be like during a future large earthquake? 2
Earthquake Ground Shaking Depends on: o Earthquake source (mechanism) and depth o Material properties along travel path o Site conditions Ground surface shaking is strongly affected by waves travelling through upper few kilometers (or less) Earthquake damage related to soft soils (i.e. low shear-wave velocity material) o 1964 Alaska, 1985 Mexico City, 1989 Loma Prieta, 1994 Northridge, 1995 Kobe Soil profile (1D structure) Sedimentary basin (3D structure)
Application of Seismic Microzonation Maps Example from 1989 Loma Prieta Earthquake in California: Areas of greater hazard identified on maps as early as 1975 Source uncertain
Seismic Soil Hazard Mapping: Work done to date in the Lower Mainland Soil hazard (amplification) map of Lower Mainland prepared for BC School Retrofit program by UBC Monahan, 2005 Regional map based on surficial geology, limited borehole data, and regional shear-wave velocity model
Project Aims Add to the database of knowledge on seismic velocities in Metropolitan Vancouver as part of seismic microzonation mapping project of the region Improved site classification and hazard assessment
Objectives 1. Update and assess earthquake site response in Metropolitan Vancouver o Earthquake recordings from December 2015 M4.7 Victoria earthquake 2. Perform site characterizationat ~15 new locations in Metropolitan Vancouver o School sites in Metropolitan Vancouver: (1) BC School Seismic Retrofit program, (2) UBC-RCAV Earthquake Early Warning System
1. Ground motion from the December 2015 Earthquake (M4.7) Assess whether ground motions amplified by local geology o For example, amplitudes (PGA) should reduce with distance but pockets of anomalous amplitude Amplification depends on: o Thickness and elastic properties of the upper soil layers (>1km) o Seismic impedence ratio Greater Vancouver M=4.7 British Columbia Victoria
2. Site Characterization Predict how earthquake ground motions may be altered by underlying geology (amplitude, frequency, duration) a) Spectral Ratio Methods o Earthquake and microtremor horizontal-to-vertical spectral ratios o Provide estimates of site period or peak frequency b) Shear Velocity Depth Profiling o Passive seismic (microtremor) arrays o Provide estimates of Vs30 (NBCC requirement)
a) Spectral Ratio Methods Single three-component sensors Characterise sites using the spectral ratio between horizontal and vertical components of motion (H/V) Ratios exhibit a maximum peak corresponding to the fundamental resonance frequency Growth of peaks towards surface = site amplification Frequency
b) Array Techniques Multiple sensors placed in a geometric array Can use the dispersive nature of Rayleigh waves to generate a dispersion curve This can be inverted to obtain a shear wave velocity profile Frequency (Hz) Velocity (m/s) Frequency (Hz) Velocity (m/s)
Impact of study Non-invasive, rapid, and inexpensive earthquake site characterization Improved estimates of shear wave velocity within Metropolitan Vancouver for use in: o Assessment of amplification and liquefaction potential o Seismic design; building and bridge codes Improved hazard estimates Improved risk (loss) estimates


 Spectral Ratio Methods")
 Array Techniques")