Understanding Outcomes-Based Funding Model Metrics
Outcomes-Based Funding Model (OBFM) is a performance funding initiative by the VCCS designed to align financial policies with strategic goals focused on improving student outcomes. The model distributes state allocation based on colleges' total points earned for various measures, including successful completion of college-level courses, student retention and progression, completions, and transfers.

Download Presentation

Please find below an Image/Link to download the presentation.
The content on the website is provided AS IS for your information and personal use only. It may not be sold, licensed, or shared on other websites without obtaining consent from the author. Download presentation by click this link. If you encounter any issues during the download, it is possible that the publisher has removed the file from their server.
E N D
Presentation Transcript
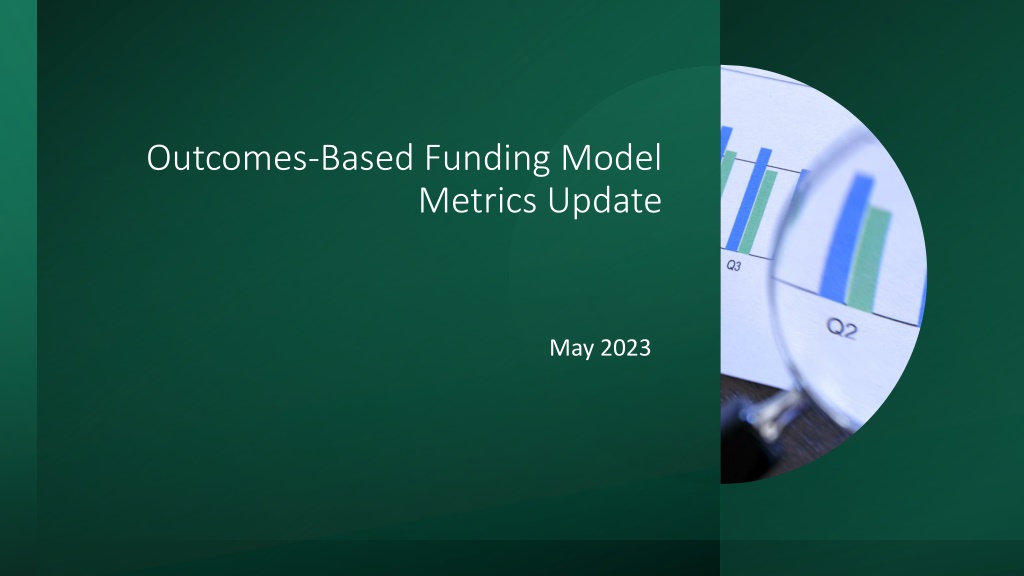
Outcomes-Based Funding Model Metrics Update May 2023
What is Outcomes-Based Funding Model (OBFM)? Also called Performance Funding Model Initiated by the VCCS in 2015 Aligned financial policies with strategic goals Designed to encourage and recognize improved student outcomes 20% of state allocation Distributed to each college based on percentage of total points earned for measures No efficiency factor
Outcomes Outcomes- -based Funding Measures are based Funding Measures are classified into three major categories: classified into three major categories: SUCCESSFUL COMPLETION OF COLLEGE-LEVEL MATH AND ENGLISH COURSES STUDENT RETENTION AND PROGRESSION COMPLETIONS AND TRANSFERS
Successful Successful Completion of Completion of College College- -Level Math and Math and English English Associates Degree Seeking FTIC Student Level Placed Placed Developmental College-Ready Cohort of Associates-degree seeking students Completes college- level English within 4 semesters Completes college- level English within 3 semesters Entered VCCS colleges for the first time in Summer or Fall Completes the course with a C or better Completes the course within timeframe Completes college- level Math within 4 semesters Completes college- level Math within 3 semesters
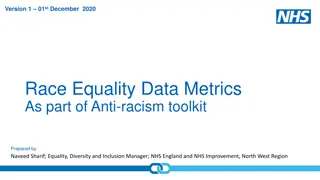
Successful Successful Completion of Completion of College College- -Level Math Math Successfully Completed College Level Math Course Within First Year 25,000 Level 20,506 19,923 20,000 18,163 18,073 17,431 17,076 16,420 Decreased developmental students from 40% to 4% of entering cohort. 16,082 15,916 15,000 Increased completion rate of developmental from 13% to 27%. 11,115 11,047 9,716 10,000 9,230 9,017 8,651 8,476 8,375 8,308 8,169 8,008 7,941 7,898 7,785 7,230 Increased college-ready student cohort by 20%. 6,259 5,000 Decreased completion rate of college-ready from 46% to 42%. 1,624 1,432 1,382 1,367 1,332 1,086 1,083 1,047 820 219 395 Increased Math Completion Rate from 33% to 42% - Fall 2013 Cohort Fall 2014 Cohort Fall 2015 Cohort Fall 2016 Cohort Fall 2017 Cohort Fall 2018 Cohort Fall 2019 Cohort Fall 2020 Cohort Fall 2021 Cohort Developmental (DE) Math DE Completed College Math College-ready (CR) Math CR Completed College Math
Successful Successful Completion of Completion of College College- -Level English English Successfully Completed College Level English Course Within First Year 30,000 Level 24,644 24,414 25,000 23,684 23,632 23,536 23,516 21,640 Decreased developmental students from 12% to 3% of entering cohort. 20,680 20,512 20,000 Increased completion rate of developmental from 33% to 52%. 16,048 15,856 15,795 15,734 15,719 15,669 14,420 15,000 13,360 12,750 Increased college-ready student cohort from 88% to 97% of entering cohort. 10,000 Decreased completion rate of college-ready from 64% to 62%. 5,000 3,479 2,782 2,617 2,114 2,018 1,923 1,767 1,122 852 811 793 390 646 334 645 638 607 591 Increased English Completion Rate from 60% to 62% over baseline year. 0 Fall 2013 Cohort Fall 2014 Cohort Fall 2015 Cohort Fall 2016 Cohort Fall 2017 Cohort Fall 2018 Cohort Fall 2019 Cohort Fall 2020 Cohort Fall 2021 Cohort Developmental English (DE) DE Completed College English College-ready (CR) English CR Completed College English
Associates Degree Seeking FTIC Student Retention in Retention in Spring and Fall Spring and Fall Part-time Full-time (<12 credits in Fall) (12+ credits in Fall) Disaggregating data by entering student course load allows us to see the differences in pathways. Returns for Returns for Spring Semester Spring Semester Returns for Returns for Fall Semester Fall Semester
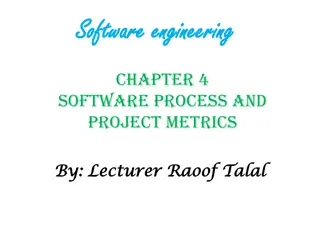
Term over Term Retention of Full-time at Entry Students 20,000 Retention in Retention in Spring and Fall Spring and Fall for Full for Full- -time 17,712 18,000 17,017 16,347 16,256 15,935 15,746 15,417 16,000 15,343 time 14,761 14,244 14,177 13,785 13,484 14,000 13,347 13,275 12,708 12,000 11,205 11,116 10,941 10,845 10,689 10,602 10,296 Smaller percentage of Fall 2021 cohort enrolled 12 or more hours than in Fall 2013. 10,031 9,818 10,000 8,483 8,269 8,000 Fall-to-spring retention dropped from 87% to 83%. 6,000 4,000 Fall-to-fall retention increased from 63% to 65%. 2,000 0 Fall 2013 Cohort Fall 2014 Cohort Fall 2015 Cohort Fall 2016 Cohort Fall 2017 Cohort Fall 2018 Cohort Fall 2019 Cohort Fall 2020 Cohort Fall 2021 Cohort Full-time at Entry (FT) FT enrolled in Spring FT enrolled in Fall
Term over Term Retention of Part-time at Entry Students 12,000 Retention in Retention in Spring and Fall Spring and Fall for Part for Part- -time 10,411 10,014 9,693 10,000 9,451 9,394 9,368 9,079 time 8,618 8,030 8,000 6,685 6,584 6,355 6,294 Larger percentage of Fall 2021 cohort enrolled less than 12 hours than in Fall 2013. 6,263 6,174 6,047 6,000 5,629 5,101 4,459 4,398 4,356 4,279 4,227 4,116 4,108 4,100 3,715 4,000 Fall-to-spring retention increased slightly from 64% to 65%. 2,000 Fall-to-fall retention increased from 43% to 48%. 0 Fall 2013 Cohort Fall 2014 Cohort Fall 2015 Cohort Fall 2016 Cohort Fall 2017 Cohort Fall 2018 Cohort Fall 2019 Cohort Fall 2020 Cohort Fall 2021 Cohort Part-time Students - Fall 2020, N PT enrolled in Spring PT enrolled in Fall
Associates Degree Seeking FTIC Student Credit Hour Credit Hour Progression Progression Student can earn up to 0.5 point for earning 12 credit hours with a cumulative 2.0 GPA by end of first spring semester. 12 college credits 24 college credits Student can earn up to 0.5 point for earning 24 credit hours with a cumulative 2.0 GPA by end of first spring semester. by end of first spring by end of second spring Previously dual enrolled student credits are counted after student enrolls as a regular student.
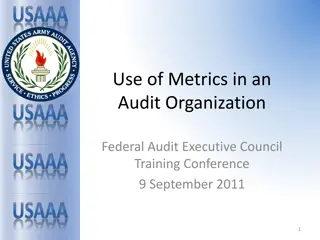
Credit Hours Earned by First and Second Spring Terms 30,000 28,123 27,031 25,838 25,798 25,650 25,439 25,303 Credit Hour Credit Hour Progression Progression 24,422 25,000 21,305 20,000 57% of Fall 2020 cohort earned 12 or more credit hours within two semesters compared to 47% in Fall 2012. 14,394 14,317 14,166 15,000 13,927 13,834 13,617 13,590 12,578 12,438 12,308 12,231 12,209 12,149 12,071 11,987 11,911 10,974 10,732 10,000 52% of Fall 2020 cohort earned 24 or more credit hours within five semesters compared to 42% in Fall 2012. 5,000 0 Fall 2012 CohortFall 2013 Cohort Fall 2014 CohortFall 2015 CohortFall 2016 CohortFall 2017 CohortFall 2018 CohortFall 2019 CohortFall 2020 Cohort PY Cohort Earned 12 credits by First Spring Earned 24 credits by Second Spring
Awarded Degrees, Diplomas, Certificates, CSCs Annual Awards Annual Awards Associate Degree or Diploma Certificate or CSC Only one award per student per year can be counted. Encourages colleges to award when student completes requirements. Underserved students include first generation, minority race/ethnicity and Pell eligible. Underserved Student Underserved Student Awards earned by dual enrolled students included. General education certificates are excluded.
Annual Degrees, Diplomas and Certificates Awarded Annual Awards Annual Awards 30,000 25,000 5,504 5,640 4,806 5,838 5,805 5,348 5,524 5,168 5,361 20,000 Degrees and Certificates awarded increased by 2% in 2022 compared to 2014. 15,000 Certificates and CSCs awarded increased by 7%. 10,000 18,615 18,399 18,077 17,842 17,818 17,721 17,714 17,655 17,364 Awards to underserved populations increased slightly in 2022 compared to 2014. 5,000 0 2014 2015 2016 2017 2018 2019 2020 2021 2022 Graduates with Associate Degree or Diploma Graduates with Certificate or CSC
Transfer to Four- Year Institution Transfers Transfers Identified in National Student Clearinghouse data as not attending a VCCS college at that time, program enrolled or dual-enrolled during the preceding academic year. Awarded Associate Degree or Diploma Earned 16+ credit hours only Transfers must earn bachelor s degree within 6 years of initial enrollment in the VCCS. Awarded Bachelor s Degree Awarded Bachelor s Degree
Transfers with 16 or more Credit Hours With or Without Associates Degree Transfers Transfers 30,000 25,000 20% increase in transfers since baseline year. 9,920 9,969 9,805 9,707 9,702 9,475 20,000 9,387 9,300 9,163 11% increase in transfers with 16 or more credits. 15,000 17% increase in transfers with associates degree. 10,000 15,912 15,845 15,829 15,709 15,637 15,499 14,710 14,593 14,316 5,000 0 2014 2015 2016 2017 2018 2019 2020 2021 2022 Transferred with 16 + credits Transferred without degree
Transfers Transfers Earning Earning Bachelor s Bachelor s Degree Degree Earned Bachelors Within Six Years of VCCS Entry 32,000 31,427 30,895 31,000 29,949 29,792 30,000 17% increase in students earning a Bachelor s degree within 6 years after entering a VCCS college. 29,616 29,261 28,836 29,000 28,219 28,000 23% increase in students earning 16 or more credits at VCCS prior to earning a Bachelor s degree. 27,000 26,435 26,000 25,000 24,000 23,000 2014 2015 2016 2017 2018 2019 2020 2021 2022
For Further Inquiries Into the Outcomes-Based Funding Model Disaggregated VCCS system data can be found within the Opportunity 2027 Strategic Plan dashboard on the vccs.edu website here. College-level data may be granted upon request at info@vccs.edu