Understanding the Importance of ETL in Modern Business Operations
ETL (Extract, Transform, Load) plays a crucial role in enabling organizations to effectively analyze and utilize their data for making informed business decisions. By extracting data from various sources, performing necessary transformations, and loading it into a central Data Warehouse, ETL facilitates data integration, consistency, and accuracy. A well-designed ETL system is essential for the success of Data Warehouse projects, allowing for data verification, comparison, and migration.

Download Presentation

Please find below an Image/Link to download the presentation.
The content on the website is provided AS IS for your information and personal use only. It may not be sold, licensed, or shared on other websites without obtaining consent from the author. Download presentation by click this link. If you encounter any issues during the download, it is possible that the publisher has removed the file from their server.
E N D
Presentation Transcript
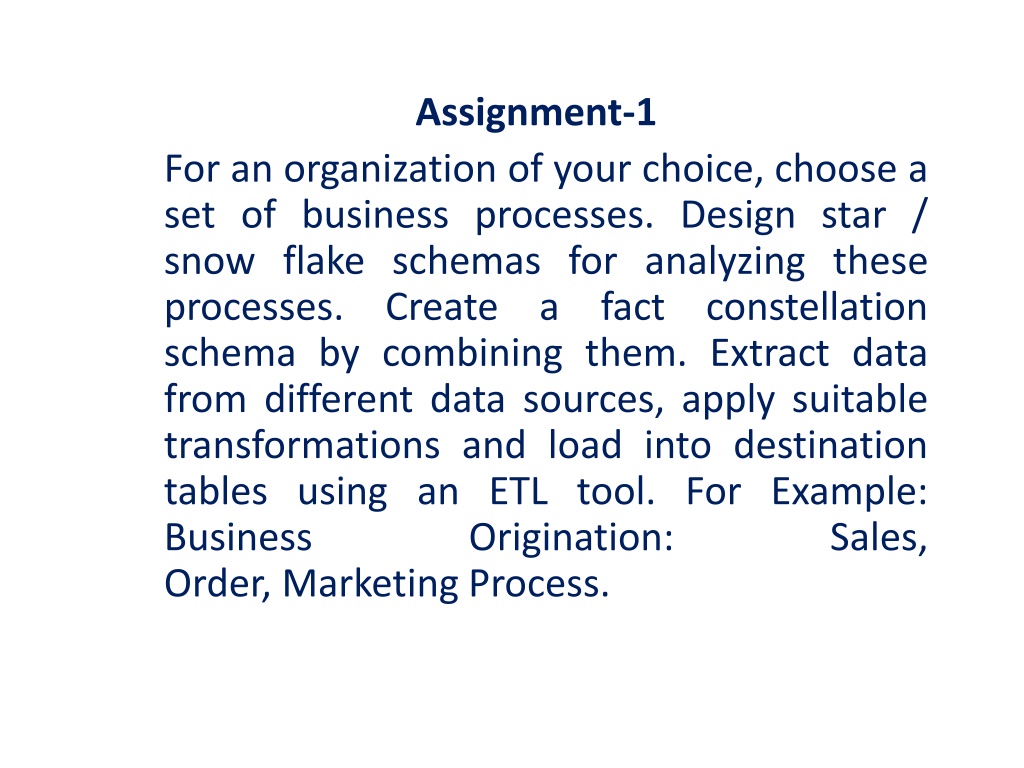
Assignment-1 For an organization of your choice, choose a set of business processes. Design star / snow flake schemas for analyzing these processes. Create a schema by combining them. Extract data from different data sources, apply suitable transformations and load into destination tables using an ETL tool. For Example: Business Origination: Order, Marketing Process. fact constellation Sales,
ETL ETL is defined as a process that extracts the data from different RDBMS source systems, then transforms the data (like applying calculations, concatenations, etc.) and finally loads the data into the Data Warehouse system. ETL full-form is Extract, Transform and Load.
Why do you need ETL? It helps companies to analyze their business data for taking critical business decisions. Transactional databases cannot answer complex business questions that can be answered by ETL. A Data Warehouse provides a common data repository ETL provides a method of moving the data from various sources into a data warehouse. As data sources change, the Data Warehouse will automatically update. Well-designed and documented ETL system is almost essential to the success of a Data Warehouse project. Allow verification of data transformation, calculations rules. ETL process allows sample data comparison between the source and the target system. ETL process can perform complex transformations and requires the extra area to store the data. ETL helps to Migrate data into a Data Warehouse. Convert to the various formats and types to adhere to one consistent system. aggregation and
Step 1) Extraction In this step, data is extracted from the source system into the staging area. Transformations if any are done in staging area so that performance of source degraded. Also, if corrupted data is copied directly from the source into Data warehouse database, rollback will be a challenge. Staging area gives an opportunity to validate extracted data before it moves into the Data warehouse. Data warehouse needs to integrate systems that have different system in not
DBMS, Communication Protocols. Sources could include legacy applications like Mainframes, customized applications, Point of contact devices like ATM, Call switches, text files, spreadsheets, ERP, data from vendors, partners amongst others. Hence one needs a logical data map before data is extracted and loaded physically. This data map describes the relationship between sources and target data. Three Data Extraction methods: Full Extraction Partial Extraction- without update notification. Partial Extraction- with update notification Hardware, Operating Systems and
Some validations are done during Extraction: Reconcile records with the source data Make sure that no spam/unwanted data loaded Data type check Remove all types of duplicate/fragmented data Check whether all the keys are in place or not
Step 2) Transformation Data extracted from source server is raw and not usable in its original form. Therefore it needs to be cleansed, mapped and transformed. In fact, this is the key step where ETL process adds value and changes data such that insightful BI reports can be generated. In this step, you apply a set of functions on extracted data. Data that does not require any transformation is called as direct move or pass through data. In transformation step, customized operations on data. For instance, if the user wants sum-of-sales revenue which is not in the database. you can perform
Following are Data Integrity Problems: Different spelling of the same person like Jon, John, etc. There are multiple ways to denote company name like Google, Google Inc. Use of different names like Cleaveland, Cleveland. There may be a case that different account numbers are generated by various applications for the same customer. In some data required files remains blank Invalid product collected at POS as manual entry can lead to mistakes.
Filtering Select only certain columns to load Using rules and lookup tables for Data standardization Character Set Conversion and encoding handling Conversion of Units of Measurements like Date Time Conversion, currency conversions, numerical conversions, etc. Data threshold validation check. For example, age cannot be more than two digits. Data flow validation from the staging area to the intermediate tables. Required fields should not be left blank. Cleaning ( for example, mapping NULL to 0 or Gender Male to "M" and Female to "F" etc.) Split a column into multiples and merging multiple columns into a single column. Transposing rows and columns, Use lookups to merge data Using any complex data validation (e.g., if the first two columns in a row are empty then it automatically reject the row from processing) Validations are done during this stage
Step 3) Loading Loading data into the target datawarehouse database is the last step of the ETL process. In a typical Data warehouse, huge volume of data needs to be loaded in a relatively short period (nights). Hence, load process should be optimized for performance. In case of load failure, recover mechanisms should be configured to restart from the point of failure without data integrity loss. Data Warehouse admins need to monitor, resume, cancel loads as per prevailing server performance. Types of Loading: Initial Load populating all the Data Warehouse tables Incremental Load applying ongoing changes as when needed periodically. Full Refresh erasing the contents of one or more tables and reloading with fresh data.
Load verification Ensure that the key field data is neither missing nor null. Test modeling views based on the target tables. Check that combined values and calculated measures. Data checks in dimension table as well as history table. Check the BI reports on the loaded fact and dimension table.
ETL tools There are many Data Warehousing tools are available in the market. Here, are some most prominent one: 1. MarkLogic: MarkLogic is a data warehousing solution which makes data integration easier and faster using an array of enterprise features. It can query different types of data like documents, relationships, and metadata. http://developer.marklogic.com/products 2. Oracle: Oracle is the industry-leading database. It offers a wide range of choice of Data Warehouse solutions for both on-premises and in the cloud. It helps to optimize customer experiences by increasing operational efficiency. https://www.oracle.com/index.html 3. Amazon RedShift: Amazon Redshift is Datawarehouse tool. It is a simple and cost-effective tool to analyze all types of data using standard SQL and existing BI tools. It also allows running complex queries against petabytes of structured data. https://aws.amazon.com/redshift/?nc2=h_m1 5] CloverETL 6] Jedox 7] Pentaho 8] Talend
The star schema and the snowflake schema are ways to organize data marts or entire data warehouses using relational databases. Both of them use dimension tables to describe data aggregated in a fact table. So we can expect to find some type of sales model inside the data warehouse of nearly every company. Let s take one more look at the sales model in both the star and snowflake schemas.
Characteristics of Star Schema: Every dimension in a star schema is represented with the only one-dimension table. The dimension table should contain the set of attributes. The dimension table is joined to the fact table using a foreign key The dimension table are not joined to each other Fact table would contain key and measure The Star schema is easy to understand and provides optimal disk usage. The dimension tables are not normalized. For instance, in the above figure, Country_ID does not have Country lookup table as an OLTP design would have. schema is widely supported by BI Tools The
A Snowflake Schema is an extension of a Star Schema, and it adds additional dimensions. It is called snowflake because its diagram resembles a Snowflake. The dimension tables are normalized which splits data into additional tables. In the following example, Country is further normalized into an individual table.
Rapidminer Assignment-1 Access Sample Dataset How to Create Local Repository Click on icon near repository ->Create Repository or Folder 1. Go to operator Section-> Click on Retrieve and Drag into design menu-> Visit Parameter Section Click on Folder Option-> Sample->Click on Titanic ->Ok For Show Result 2.Connect the output port to res ie result port- >Click on RUN button see result. Row=Record Column=Attribute/varriable
Assignment-2 Importing Data 1. Down Customer Churn dataset from google Churn rate (sometimes called attrition rate), in its broadest sense, is a measure of the number of individuals or items moving out of a collective group over a specific period. Loyality- Existing Customer Company want to find Who is going to be Churn & Who is going to be Loyal
1. Visit Repository Section-> Select my first prediction->Create sub Folder Data in same.-> Create sub folder process in same. 2. Click on Add Data/Import data tab -> browse data from Computer->Next->Load data it look like Spreadsheet->it shows all data selected.->if you want see result type b,c in cell range->See the Result-> Next->Click on last transaction-> see all option Eg. Churn- polynomial 3. Click on Change role->Select label->on
It shown Churn Column in green color mean special role. Other Attribute are Regular Attribute Now Select my First Prediction->Data Folder- Give name Customer Data->Finish Rapidminer Loaded this data in result view To Retrive data Drag and drop Customer Data from repository to design view
Assignment 3 Visualizing data See the Example dataset (Retrieve Customer data) Click on any cell perform the operation
Now Click on Age->Click on hyperlink-> See the Result Select Xaxis-Age vs Yaxis as transaction add the same see both graph Select different chart style Change color Export images by click on export menu in right corner->File Print
Assignment 4 Perform various Operation Load Titanic Dataset See no of rows and column See the Structure and unstructured data Like name or ticket no while cabin is unstrct. See cleanse section-> Select life boat column
Click on any cell->Right Click->See details- >Click on dummy encoding Apply Click on icon see the description
Select Attribute see the Possible Operation shown
See the Steps in help Click on Auto Cleansing->Next->Next ->Finish- >see row Column value now Click on Model
Home Work Merging Data Pivoting Data Data Preparation https://www.youtube.com/watch?v=Gg01mmR3j- g&list=PLssWC2d9JhOZLbQNZ80uOxLypglgWqbJA


 Extraction")


 Transformation")
 Transformation")


 Loading")