Fisheries Management Summary 2021-2022
Reviewing commercial fishing statistics for horseshoe crab, menhaden, and summer scup in 2021 and proposing draft quotas and distribution for 2022. The data includes landings, quotas, trip limits, and distribution periods for each species. Noteworthy changes and regulations for each fishery are highlighted to aid in understanding the upcoming management strategies.

Download Presentation

Please find below an Image/Link to download the presentation.
The content on the website is provided AS IS for your information and personal use only. It may not be sold, licensed, or shared on other websites without obtaining consent from the author. Download presentation by click this link. If you encounter any issues during the download, it is possible that the publisher has removed the file from their server.
E N D
Presentation Transcript
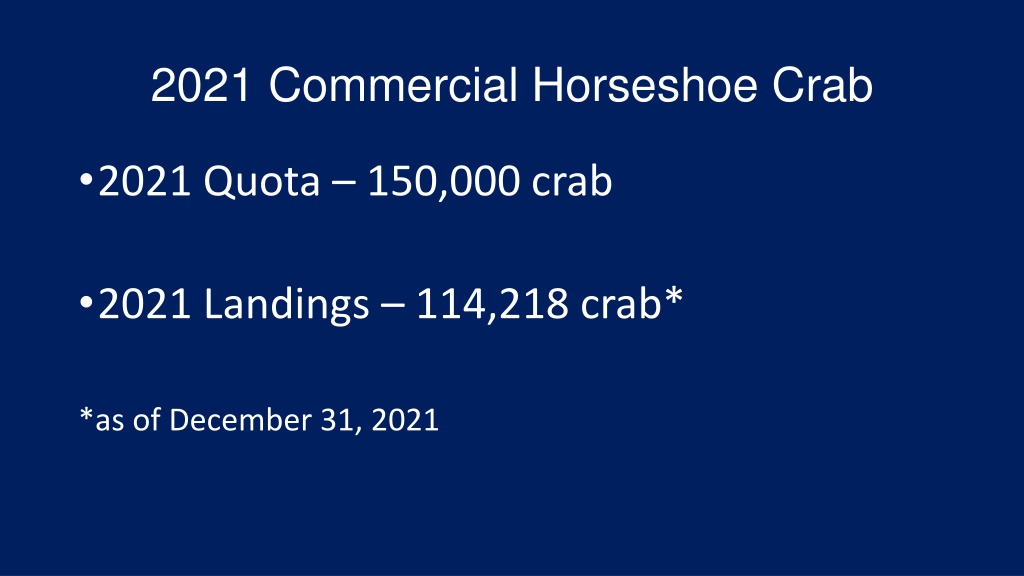
2021 Commercial Horseshoe Crab 2021 Quota 150,000 crab 2021 Landings 114,218 crab* *as of December 31, 2021
2022 Commercial Horseshoe Crab DRAFT 2022 Horseshoe Crab Quota Distribution Quota (# of crab) Dates Initial Trip Limit % Distribution Periods 1 January 1 - April 15 6,000 30 4% 2 April 16 August 31 138,000 150 92% 2-closed May 28 June 1 closed 0 closed 2-closed June 12 June 16 closed 0 closed 3 September 1 November 30 6,000 250 4% TBD1 TBD1 TBD1 4 December 1- December 31 1 Period 4 fishery will open if there is quota remaining and 90% reporting compliance
2022 Menhaden 2021 Quota 2,934,618 lbs 2021 Landings 2,992,271 lbs. Preliminary 2022 Quota 2,934,618 lbs. Daily trip limit 10,000 lbs.
2021 Summer Scup May 1 through Sept. 30 Summer Scup quota 1,263,608 lbs. Landings 1,261,599 lbs. 2021 Weekly Summer Scup May 1 through June 15 4,000 lb. weekly trip limit (maximum of 2 landings per week) Scup- In August of 2018, the Mid Atlantic Fishery Management Council (MAFMC) voted to set an incidental small mesh bycatch exemption to 2,000 lbs., April 15 June 15 Primary management data source SAFIS daily reports
2021 Summer Scup Landings & Trip Limits by Week 1000 140,000 900 900 120,000 800 800 100,000 700 600 80,000 600 Trip Limits (lbs.) Landings (lbs.) 500 60,000 400 300 40,000 4,000 lb. weekly limit 200 20,000 100 0 0 1 2 3 4 5 6 7 8 9 10 11 12 13 14 15 16 17 18 19 20 21 22 July August May June Trip Limit Landings
2021 Summer scup - Quota (with rollover) vs. Landings 800,000 758,165 757,121 100% 700,000 600,000 500,000 392,249 103% 380,126 400,000 300,000 112,229 98% 200,000 114,238 100,000 0 July - August 1 2 3 May - June Sept Quota landings
DRAFT 2022 Commercial Summer Scup Commercial quota Scup Summer Period % Summer Quota NY Summer period % 2022 NY Summer Period Quota 1,256,163 Distribution 20,380,000 38.95% 7,938,010 15.82466% Periods 1 (May - June) 2 (July - August) 3 (September) Decrease of 7,445 lbs. 60% 30% 10% Percent 125,616 753,698 376,849 2022 Quota 1,256,163 900 800 600 Proposed Trip Limits
2021 Commercial Bluefish 2021 Commercial Bluefish 2021 Bluefish quota - 387,667 lbs.* *287,667 lbs. initial quota. 100,000 lbs. transfer (50,000 lbs. in June, 50,000 lbs. in July) Landings; 323,872 lbs.* *as of December 31, 2021 Primary management data source SAFIS daily updates
2021 Bluefish Landings & Trip Limits by Week 600 70,000 60,000 500 500 50,000 400 Trip Limits (lbs.) Landings (lbs.) 40,000 300 280 30,000 200 20,000 100 10,000 100 0 0 1 2 3 4 5 6 7 8 9 10 11 12 13 14 15 16 17 18 19 20 21 22 23 24 25 26 27 28 29 30 31 32 33 34 35 36 37 38 39 40 41 42 43 44 45 46 47 48 49 50 51 52 53 Sept Oct July Aug Jan April May June Trip Limit Landings
2021 Bluefish - Period Quota (with rollover) vs. Landings (in pounds) 250,000 231,527 200,000 154% 150,652 150,000 96,576 100,000 79,393 69,776 42,209 43,150 50,000 34,443 60% 95 36% 14,429 0% 18% 0 July - August 1 2 3 4 5 May - June Sept - Oct. Jan - April Nov. - Dec. Quota landings
DRAFT 2022 Commercial Bluefish DRAFT 2022 Commercial Bluefish Bluefish Commercial Quota NY Commercial % 2022 NY Commercial Quota 414,693 3,540,000 11.7145% Period 4 (Sept- Oct) Period 5 (Nov - Dec) Periods Period 1 (Jan-Apr) Period 2 (May-June) Period 3 (July-Aug) Increase of 127,026 lbs. 10% (-5%) 45% (+15%) 25% (-5%) 15% (-4%) 5% (-1%) Percent 100% 414,693 41,469 186,612 103,673 62,204 20,735 2022 Quota 1,000 210 210 210 210 Proposed Trip Limits
2021 Commercial Black Sea Bass 2021 quota 426,300 pounds Landings; 412,943 lbs.* *as of December 31, 2021 Primary management data source SAFIS daily reports
2021 Black Sea Bass Landings and Trip Limits by Week 250 25,000 210 200 20,000 150 15,000 Trip Limits (lbs.) Landings (lbs.) 150 100 10,000 70 50 5,000 2 Permit Holder 0 0 1 2 3 4 5 6 7 8 9 10 11 12 13 14 15 16 17 18 19 20 21 22 23 24 25 26 27 28 29 30 31 32 33 34 35 36 37 38 39 40 41 42 43 44 45 46 47 48 49 50 51 52 53 Sept Oct May June July Aug Jan April Trip Limit Landings
2021 Black sea bass - Period Quota (with rollover) vs. Period Landings 160,000 149,205 145,743 144,559 95% 132,536 140,000 120,000 100,000 91,483 72,053 80,000 61,721 54% 57,703 56,484 60,000 42% 42,630 63% 132% 40,000 20,000 0 July - Aug 1 2 3 4 5 Quota landings Nov - Dec Sept - Oct Jan - April May - June
DRAFT 2022 Commercial Black Sea Bass Commercial Quota Black Sea Bass NY Commercial % 2022 NY Commercial Quota 633,413 6,470,000 9.79% Proposed Periods 1 (Jan - April) 10% 2 (May - June) 42% (35%) 266,033 221,694 3 (July - August) 23% (30%) 145,685 190,024 4 (Sept - Oct) 20% 5 (Nov - Dec) 5% Increase of 100% Percent 633,413 63,341 126,683 31,671 2022 Quota 207,113 lbs. 150 100 150 150 100 Proposed Trip Limit
2021 Commercial Fluke 2021 quota 1,094,113 lbs. Landings; 997,720 lbs.* *as of December 31, 2021 Primary management data source SAFIS daily reports
2021 Summer Flounder Landings & Trip Limits by Week 1200 50,000 45,000 1000 1,000 40,000 35,000 800 30,000 Trip Limits (lbs.) Landings (lbs.) 600 25,000 20,000 400 15,000 350 280 10,000 200 210 5,000 140 2,000 lb. weekly limit 70 0 0 1 2 3 4 5 6 7 8 9 10 11 12 13 14 15 16 17 18 19 20 21 22 23 24 25 26 27 28 29 30 31 32 33 34 35 36 37 38 39 40 41 42 43 44 45 46 47 48 49 50 51 52 53 May June July Jan Feb March April August Sept Oct Trip Limit Landings
2021 Summer flounder- Quota (with rollover) vs. Landings 500,000 458,248 450,000 430,689 400,000 350,000 299,883 300,000 65% 250,000 228,624 218,823 203,270 104% 191,264 200,000 171,072 164,116 44% 104% 150,000 100,000 53,202 50,000 26% 0 1 2 3 4 5 May - July August Oct. Nov. Dec. Jan. Feb. March - April Quota landings
DRAFT 2022 Commercial Fluke Commercial Commercial Quota * Quota * 15,530,000 15,530,000 2022 Quota 2022 Quota 1,470,779 1,470,779 Fluke Fluke Commercial quota Commercial quota Increase of Increase of 266,315 266,315 lb lb Periods Periods 1 (January 1 (January - - Feb) Feb) 2 (March 2 (March April) April) 3 (May 3 (May - - July) July) 4 (August 4 (August - - October) October) 5 (Nov 5 (Nov - -Dec) Dec) % Distribution % Distribution 25% (+5%) 25% (+5%) 20% 20% 15% 15% 35% ( 35% (- -5%) 5%) 40% 40% 20% 20% 5% 5% 100% 100% 2022 Period Quota 2022 Period Quota 367,695 367,695 220,616 220,616 514,773 514,773 294,156 294,156 73,539 73,539 1,470,779 1,470,779 (2,000/280) TBD/140 140 100 100 Proposed Trip Limit Proposed Trip Limit


 vs. Landings")


 vs. Landings")


 vs.")


 vs. Landings")