Real-Time Data-Driven Network Security Workshop by Joe St. Sauver

Explore the insightful workshop on batch versus flow processing in network security conducted by Joe St. Sauver from Farsight Security, Inc. The workshop delves into the dynamics of near-real-time security data analysis and its importance in today's cyber landscape. Joe's unique presentation style and background bring a fresh perspective to the topic, making it engaging and informative for attendees. Dive deep into the realms of data-driven security strategies and stay ahead in safeguarding network integrity.

Download Presentation

Please find below an Image/Link to download the presentation.
The content on the website is provided AS IS for your information and personal use only. It may not be sold, licensed, or shared on other websites without obtaining consent from the author. Download presentation by click this link. If you encounter any issues during the download, it is possible that the publisher has removed the file from their server.
E N D
Presentation Transcript
Batch Versus Flow: "Real-Time" Data-Driven Network Security NWACC Information Security Workshop 2:00-3:00 PM, Tuesday, October 18th, 2016 Courtyard by Marriott, Portland City Center Joe St Sauver, Ph.D. (stsauver@fsi.io) Scientist, Farsight Security, Inc. https://www.stsauver.com/joe/batch-vs-flow/
Thanks For The Chance To Talk Today! I'd like to thank Adrian for the invitation to be with you today. NWACC has always been a favorite organization, and not just because they created the Joanne Hugi Award for my former boss. I recognize that it's somewhat unusual to have a now non-higher ed person at an NWACC, so let me also say that I appreciate the opportunity to see many of my old friends from higher ed again. Disclaimer: Because I (still!) wear a lot of hats, let me be clear that today I'm here as a Scientist from Farsight Security, Inc., and I'm NOT speaking on behalf of the REN-ISAC TAG, M3AAWG, the Online Trust Alliance, Cybergreen, Global Cyber Alliance, CAUCE, Broadband Technical Advisory Group, etc. While I appreciate feedback I've received from colleagues on this talk, I'm solely responsible for any errors or other issues. Questions? Feel free to ask at any time... 3
Yes, My Slides Are Still In That "Weird Joe Style..." I tend to write very detailed slides. If you're not used to my slide style, they'll look weird to you. For those of you who may not already know, I write my slides this way so that: I can try to stay on time while still covering a lot of material You don't need to try to take notes (I always share my slides) People who aren't here today and who look at these slides after-the-fact can still figure out what I was trying to tell them This talk will be accessible to those who are deaf or hard-of- hearing (these slides == captioning for those audiences) This talk will get well-indexed by Google, Bing, etc. I don't end up getting misquoted (I hate to get misquoted) I promise, I won't read these slides word-to-word for you. You don't need to try to read them as we go along, either. 4
Those Were The Days, My Friends... Many years ago -- before I ever did anything cyber security-related -- I was a statistical consultant at the University of Alaska-Fairbanks and then again for the University of Oregon Computing Center. My terminal degree from the U of O Business School is actually in Production and Operations Management (e.g., "quantitative business stuff" such as linear programming, inventory management, factory layout, personnel scheduling, etc.). With that sort of odd background, talking about batch vs flow processing and near-real-time security data analysis just seemed somehow right. :-) Moreover, this topic also reconnected nicely with some of the work I did for Internet2, back when I was their Security Programs Manager under contract through the University of Oregon. 5
The Security Information Exchange (SIE) When I was Internet2's Security Programs Manager, I convened two Data Driven Collaborative Security Workshops (DDCSW) (sometimes mistakenly called the "Friends of Joe meetings"): -- DDCSW, Univ. of Maryland-Baltimore County, May 21-22, 2009 -- DDCSW 2, Washington Univ. in St Louis, Aug 17-18, 2010 Andy Fried, representing ISC, talked about SIE during DDCSW I, see https://web.archive.org/web/20100626065352/http://security.int ernet2.edu/ddcsw/docs/fried_.pdf Eric Ziegast, then also with ISC, talked about NMSG (the data format that is used for the majority of the data shared across SIE) at DDCSW II (working on recovering copies of those talks). Little did I know that SIE was going to show up in my life again when I went to work as a Scientist for Farsight Security, Inc.: SIE was among the core assets that Dr. Paul Vixie purchased from ISC when he founded Farsight. 6
Why Mention SIE Here? It's FLOW Based/Continuous Unlike many other security data distribution efforts SIE is continuous/flow-based rather than batch or sample-based. SIE is not the ONLY continuous/flow-based model, however. For example, see also http://www.ren-isac.net/ses/ (emphasis added): Objective Improve timely local protection against cyber security threat, by sharing security event information, in near-real time, within a trusted federation, and among federations. For an example of a data sharing effort that tends to be more batch or sample-based, see the DHS IMPACT (Information Marketplace for Policy and Analysis of Cyber-risk & Trust) Project (formerly PREDICT), https://www.impactcybertrust.org/ Another nice resource describing some ongoing and one-time data snapshots: http://www.caida.org/data/overview/ 7
So What Is SIE? The Security Information Exchange is a way to share security information in near-real time with other participants Technically, it's a set of 10 gig Ethernet switches that support the distribution of specific near-real-time security data streams as broadcast "channels," kin to cable TV channels: You can "listen" to a channel with raw or processed passive DNS traffic You can "listen" to a channel with dark space telescope traffic You can "listen" to a channel with spam samples You can "listen" to a channel with [...] ( https://www.farsightsecurity.com/Technical/fsi-sie-channel-guide.pdf ) SIE is like being able to get your own near-real-time pre-built security sensor network for research or operational purposes See the following slide for a conceptual overview of how one of SIE's data streams gets created and processed. 8
"Real-Time SIE Waterfall Processing" The easy-to-miss bit from the preceding diagram (even when I've boxed it in red!) is the "real-time waterfall processing" comment... "Real-Time?" More accurately, "NEAR-real time. (At least to me, TRUE "real-time" means millisecond time scales and a true RTOS (https://en.wikipedia.org/wiki/Real-time_operating_system )). SIE latencies are still very low, however, typically just seconds). "Waterfall?" A very appropriate term for SIE data: -- At least some data at SIE, such as passive DNS data, gets cascaded down through successive stages of processing and refinement, like water falling through a series of cataracts -- The volume of data on some SIE channels can be somewhat overwhelming, just like the volume of water coming off a waterfall (note to self: never try standing in the water coming off an actual waterfall, F=ma applies even to water!) 10
Who Uses SIE? Farsight itself uses SIE: we us data from SIE for DNSDB (our passive DNS product), as well as for other Farsight products We also sell access to SIE to vetted commercial customers (but this is not a sales spiel and I'm not a sales guy). If you are a higher education institution and potentially interested in SIE access for operational security purposes, drop me a note and I'll be happy to connect you with the right folks, particularly if you're a member of a higher education cyber security trust community or you'd like to talk about potentially trading data for discounted access. Approved academic researchers (vetted faculty and grad student researchers) can request FREE (or, in some cases, cost-recovery- only) access to SIE for research purposes. This SIE option is, and has been, grossly underutilized IMO. I'd like to fix that. 11
Dipping A Bucket vs. Running a Hydro Plant Let's get back to batch vs. flow... Most statisticians are used to working with samples. Taking a sample his is analogous to dipping a bucket into a river and pulling out some water. If you like "dipping buckets," you can still do so at SIE: we make it easy to extract and save a sample of SIE data and then process it as you normally would. For example, for one paper, I took roughly 30 million observations from the SIE "DNS Changes" channel during a 24 hour period ending May 22nd, 2015. (Dividing that out, on average that's about 360 obs/second). However, the real challenge is getting to the point where you can comfortably harness a continual stream of data at scale, much in the way that a hydroelectric plant routinely/continually uses the huge volume of water surging through its penstocks. Today's talk is really about beginning to make that paradigm shift, going from dipping a bucket to emulating Bonneville. 12
II. Batch vs. Flow In Everyday Life, and In Data-Driven Cyber Security Operations
Batch vs. Flow Processes in Everyday Life Batch Process: A dairy makes a batch of vanilla ice cream, then a batch of chocolate chip cookie dough, then a batch of chocolate, then a batch of strawberry, ... A shoe factory makes a batch of running shoes, then a batch of loafers, then a batch of work boots, then a batch of cowboy boots A tanker truck load of acetone gets delivered to its purchaser. Flow ("Continuous") Process: A petroleum refinery continually produces unleaded gasoline for passenger cars, diesel fuel for home heating and diesel vehicles, asphalt for paving, etc. A water purification plant continually processes water from a reservoir for distribution to homes and businesses. A pipeline delivers natural gas for use in industrial processes and use in home gas appliances (water heaters, furnaces, ranges, etc.) 14
Why Choose Flow? Why Choose Batch? Flow Batch (Usually) dedicated facilities Long planning horizon with readily predictable demand Broad user base High volume, low margin Few (regulated?) producers High change costs (e.g., "build a new petroleum fractioning plant") Produce for immediate-use (typically little inventory) Monitored in real-time General purpose facilities Uncertain demand/ad hoc market ("this year's style...") Diverse user requirements Low volume, high(er) margin Many potential competitors Low change costs (e.g., "hose out the mixer, then start up a batch of chocolate") Produce for inventory Quality control stats may be run on a per-batch basis 15
Objective of Monitoring/Quality Control In Real Life Whether you're doing continuous monitoring of a flow process, or computing per-batch stats for a batch processes, the objective in real life is typically the same: you want to quickly catch anything that's anomalous or "out-of-spec." Parts that are dimensionally incorrect due to operator error or tool wear, for example, may end up having to be scrapped. Obviously you want to minimize the number of parts you need to rework or junk. Processes that are not running as expected may need to be quickly corrected to prevent production of defective products or damage to the production facility itself. For example, it's really bad if water flows through a water treatment plant without the right levels of purifying chemicals. That's thinking about "real life" processes. What about the data- driven cyber security case? 16
Batch vs. Flow WRT Collecting Cyber Security Data Batch Process: A campus does a one-time scan of its network to identify vulnerable CCTV cameras exploitable by the Mirai botnet (https://www.incapsula.com/blog/malware-analysis-mirai-ddos- botnet.html ) A daily cron job runs to summarize syslog files for distribution to relevant system administrators and the IT security department. A forensic review is performed on suspected compromised hosts. An Sflow probe is installed to diagnose a new tricky network issue. Flow ("Continuous") Process: An IDS passively monitors border traffic for anomalous traffic, generating alerts if a hit occurs. SNMP counters on network devices are continually polled to ensure that network traffic levels (packets/sec, octets/sec, etc.) are nominal, often updating RRDtool graphs with the results. Netflow data gets collected at the border and routinely archived. 17
Why Monitor Cyber Security Data? In the cyber security world, we want to detect anomalies (anything that's "out-of-spec") when it comes to network traffic or the operations of systems. We want to discover security anomalies as soon as they occur to limit the damage that may occur or the magnitude of the remediation efforts we may need to undertake. Other times, you may only be able to effectively collect crucial intelligence in real time: if you're experiencing a DDoS, you want to detect it while you can still potentially work with other operators to volumetrically trace spoofed traffic to its source. That's one reason why it's so important that we move from a batch mode of operation to a continuous flow process for cyber security data-driven operations. Let's focus for a minute about some of the issues with a batch- oriented mode of security data collection. 18
III. Why Using Traditional Batches Can Be A Challenging Choice
Some Batch-Related Issues 1) Latency may cause decision making to be "deferred" 2) Non-representative samples may mislead the decision maker 3) Averaging effects may mask critical phenomena 4) Batch size vs. power: we can minimize some batch-related effects by reducing the size of batches, but then we may lose statistical power, and become unable to detect genuine differences 5) Data collected as batches can quickly become historical, and a historical focus limits our ability to evolve what's collected 20
1) Latency Collecting batches of data takes time. During that time, decision making may be "deferred." This can potentially cause "issues." "Hypothetical" example: assume a plane's altitude (as reported by its altimeter) lags the true altitude of the airplane. Obvious issue? You'd like the altimeter to accurately report the plane's ACTUAL altitude NOW so you don't accidentally "fly too low." Bad news: a lag in reporting changes in altitude is actually a real phenomena, normally referred to as "altimeter hysteresis." "Good" news: "This error has been significantly reduced in modern altimeters and is considered negligible at normal rates of descent for jet aircraft." [see http://www.pilotfriend.com/training/flight_training/fxd_wing/alt. htm] (emphasis added) Note to already-nervous fliers: traditional altimeters now get augmented with other instruments (such as radar altimeters) to minimize or eliminate this sort of issue in practice. 21
Latency And Cyber Security Data Latency can be a problem for cyber security data-driven operations, too. As a simple example, imagine a signature based antivirus program that only updates its antivirus definitions once a week... During much of the week, newly-released malware would be able to run wild (well, it may be able to do that normally, but I digress). Or think about data-exfiltration: if you only review outbound flows for suspicious activity once a day, an intruder might be able to fully transfer any/all files of interest before that intrusion was detected. Blocking exfiltration attempts would become impossible Or as a third example, imagine if a spammer can freely use a spamvertised domain for days before the domain is blocked, seized or otherwise handled, that's the definition of "works!" We need an approach that's lower latency and closer to "real- time" for most cyber security work. 22
2) Non-Representative Samples A fundamental assumption behind statistical approaches is that samples can be drawn which are representative of the underlying population. Representative samples allow us to measure our sample, and then extrapolate from the sample to the population. Done right, we'll get good population estimates. But consider things like national presidential polls: if we have a sample of 3,000 Americans, that's only 60 people per state. Will you allocate that sample "evenly" to each state? If so, the preferences of people in sparsely populated states (such as Wyoming or South Dakota) will be disproportionately influential relative to highly populated states such as California or New York. And if you just take a simple random sample, will you be able to accurately estimate the true sense of small (but potentially highly influential subgroups) based on a tiny number of participants? More complex weighting schemes typically have a lot of value. 23
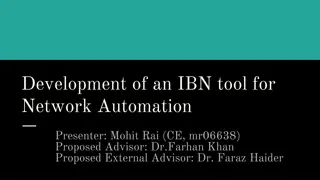
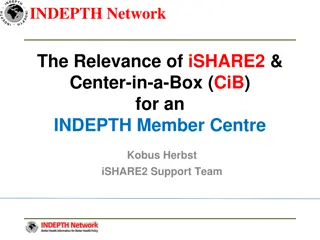
Non-Representative Samples In Cyber Security Data Let's think about Netflow data a little. Sometimes Netflow is collected as "every Nth flow" in order to get "1-in-N Sampled Netflow." Unfortunately, that's NOT a random sample (defined to be "every observation has an equal probability of being selected"). There is 0% chance that if you selected observation foo, you'd also select observation foo+1. You'd only ever get foo, foo+N, foo+2N, etc. This means that if you're collecting 1-in-100 Netflow, and an attacker is squirting a fifty packet burst of random UDP traffic at you as an attack, on a lightly loaded circuit you'd never see that entire fifty packet burst at best, you might only see one packet from that burst. How could you select a truly random 1% Netflow sample? Draw a uniform random number from [0,1] for each flow. If the random number is <= 0.01, then select that flow as part of your sample.24
Sampled Netflow vs RANDOM Sampled Netflow Source: http://www.cisco.com/c/en/us/td/docs/ios/12_0s/feature/guide/nfstatsa.html 25
More Non-Representativeness Data collected from "eyeball network" contributors (such as ISPs or Universities) will inherently vary potentially dramatically over the course of the day due to time zone differences. This can particularly be a consideration if you have a global sensor footprint. If you're taking samples (batches) with less than daily duration (such as samples that are just a few hours long), you run the risk of getting samples that may be influenced (dominated?) by just one geographic region or another. This may skew your conclusions (hypothetically, news.sky.com and dw.com are the "most popular online news sites"?) 26
The Impact of Opaque Sensor Distributions Security data sharing collectives need to protect the identity of their sensor operators for many reasons, including a desire to avoid tipping off the bad guys about what is/isn't instrumented. (We don't want the bad guys to get "camera shy" and we don't want the sensor operators to end up taking any extra packet love as a result of being public spirited and sharing data) As a result, privacy assurances made to sensor operators often prohibit disclosure of sensor operator identities or locations. For example, Farsight does not confirm or deny who may be contributing data, or where sensor nodes are located. Terms of service will typically prohibit attempts at back engineering that information through traffic analysis as well. Why do you care? Opaque sensor distributions make it harder to try to explicitly weight samples to account for sensor distributions. 27
3) Averaging Effects In any given sample, there will be high values and lower values. By pooling those values and then computing a mean value, one can smooth the data over that interval and remove "noise." However, often it may be the peaks or troughs that matter, not the averages. By only reporting the average for a batch, critical information may be overlooked. Contrived example: -- Inbound network traffic flattops for five minutes due to a packet flood -- That same network then has a five minute total outage. -- Averaged over that ten minute period, how do things look? Pretty good, right? No problems noted? That's a problem. 28
4) Batch Size vs. Power In statistical hypothesis testing, the question asked is, "Is there a meaningful difference between two or more groups (batches)?" Being able to find that difference may be a function of the size of the samples (batches) collected for the different treatments. Small samples may be easy and cheap to gather, and have low latency, but lack statistical power: that is, differences may actually exist, but the samples may be too small for that difference to be detected as "statistically significant." Larger samples have more statistical power, but may take longer to collect, or cost more to collect, or collecting large samples may mean that fewer experimental conditions can be tested. If you're drawing samples (batches), even if you're not empirically doing hypothesis testing, the size of your sample will still impact the width of the confidence intervals around your estimates. 29
Just Scan/Crawl The Whole Thing? Strangely enough, any discussion of sampling Internet phenomena needs to recognize that you potentially have an alternative available to you that most investigators don't: you can potentially conduct a census rather than just drawing a sample. "Here s what you find when you scan the entire Internet in an hour," https://www.washingtonpost.com/news/the- switch/wp/2013/08/18/heres-what-you-find-when-you-scan-the-entire- internet-in-an-hour/ BTW, if that's still "too slow" for you, check out https://github.com/robertdavidgraham/masscan ("TCP port scanner [...] scanning entire Internet in under 5 minutes.") Of course, you may not NEED to scan/crawl the whole thing there are projects out there where people are voluntarily sharing the data they've already crawled. An example? https://github.com/trivio/common_crawl_index ("The Common Crawl data is composed of billions of pages randomly crawled from the internet...") 30
5) Batched Data: Data Quickly Becomes Historical Data people are often data "packrats"/ data "hoarders" and may keep "inventory" (batches of data) long past the point where that data is operationally relevant Don't get me wrong: historical data may be of immense research value, particularly for things like estimating long term trends, and definitely should be preserved, it just often isn't of particular operational value as it gets old(er). By default, one to three months to a year is probably the relevant operational horizon for most data sets. Carrying too much data increases your storage costs, may increase processing time, may swamp more recent/relevant data, and may invite 3rd party data safaris (you should be thinking "records management"). Now is generally much more important than "way back when." 31
What /How We Collect Can Become "Cast In Stone" A historical data focus often puts a premium on comparability: we want to be able to look backwards, and compare what we see today with what we saw "way back when." Maintaining comparability means that we basically can't change the questions we ask or the answers we accept if we do, we'll "lose comparability." Hence, what we collect often tends to get "cast in stone" even if conditions change. One easily identified exception: decomposing an aggregate measure into its component elements 32
Decomposing An Aggregate Measure In 2014, the Department of Education changed how sex offenses were reported in annual Campus Safety and Security data. Offenses that were formerly lumped into just one or two categories were now broken out more granularly. See http://ope.ed.gov/campussafety/#/ The historical aggregate measures could still be replicated, however, by adding up now-broken-out component offenses. 33
III. So Is Continuous Flow Process Monitoring Really Just The Best Thing Since Sliced Bread?
Continuous Flow Approaches Have Drawbacks, Too I do NOT want you to come away from this talk with the simplistic impression, -- "Batch: Bad," -- "Continuous Flow: Good." The reality is a little more nuanced. Just as working with batches has limitations, working with continuous flow data can have its drawbacks, too. 35
Some Flow/Continuous Monitoring-Related Issues 1) You need to learn to throw stuff away... 2) You also need to remember what you've seen 3) Continuous monitoring never sleeps will you? 4) Data collected as batches can quickly become historical, and a historical focus limits our ability to evolve what's collected 36
1) You Need To Learn To Throw Stuff Away... For example, even just keeping the fully qualified domain names seen in an SIE channel, you may still find real time unfiltered data flows a bitmuch to just visually scan as they flow by... $ nmsgtool -C ch202 -c 100000 -o - | grep "qname:" | awk '{print $2}' Which means: -- Collect 100,000 observations from SIE Channel 202 -- Keep just the qname records -- Keep just the 2nd column from the qname records 37
Finding What To Filter Using Effective 2nd Level Domains If you are working with FQDNs, you may be able to identify a few effective 2nd-level domains that you can safely exclude... $ nmsgtool -C ch202 -c 100000 -o - | grep "qname:" | awk '{print $2}' > temp.txt $ 2nd-level-dom < temp.txt > temp2.txt $ sort temp2.txt | uniq -c | sort -nr > temp3.txt If you see common-but-unlikely-to-be interesting domains in the resulting list, you may want to "skim off"/"filter out" all the routine stuff that simply isn't relevant... grep -f is your friend: $ [whatever] | grep -F -v -f killfile.txt 39
the little 2nd-level-dom script #!/usr/bin/perl use strict; use warnings; use IO::Socket::SSL::PublicSuffix; my $pslfile = 'public_suffix_list.dat'; my $ps = IO::Socket::SSL::PublicSuffix->from_file($pslfile); my $line; foreach $line (<>) { chomp($line); my $root_domain = $ps->public_suffix($line,1); printf( "%s\n", $root_domain ); } Note: To get a copy of public_suffix_list.dat, see https://publicsuffix.org/list/ 40
2) You Also Need to Remember What You've Seen Assume we're monitoring continuous flow data, and something "blips on the radar." Will you be able to "rewind the tape" and retrospectively dig into what you saw, if you need to do so? Sometimes, however, there may be a tendency to just save the "interesting bits," with the result that some of the "boring bits" (that may actually turn out to be interesting bits, once we have a little more insight) may end up lost to history. Example: we just looked at domain names in that lightning-fast tour of ~100,000 domains. If we wanted to go back and see the full records from that sample, we couldn't. Netflow is normally excellent about this sort of thing regardless of what else happens, most sites that deploy Netflow dump a copy of what gets captured to disk, and save that data at least for a while. (Of course, Netflow is already pretty heavily summarized) 41
3) Continuous Monitoring Never Sleeps Will You? Continuous flow monitoring is normally either attended, or set to generate alerts when an anomalous condition is automatically flagged, just like a good burglar alarm. There should be a "security guard"/"responsible adult" to respond when a problem does get noticed everybody's got a 24x7-staffed Security Operations Center, right? Nobody's running on "autopilot" overnight or on weekends because there's "nothing going on" (or because there was a need to cut payroll...)... right? 42
Setting Proper Threshold Values Is Key To Your Sanity Continuous monitoring forces you to think explicitly about operationalizing your threshold values. What's bad enough to justify waking you up in the middle of the night? Put another way, how often would you like to be woken up, on average? Once a night? Once a week? Once a month? Once a quarter? Once a year? Never? Don't just pay attention to peaks, either a sustained traffic pattern JUST UNDER your threshold value may (in aggregate) be more worthy of attention than a brief-if-extreme spike. 43
Being Responsive To Real Changes, Not Noise There will always be some normal variation (or "noise") in any continually monitored process. Analysts normally attempt to reduce that "noise" when doing process monitoring by using a moving average or exponential smoothing (the two are equivalent techniques) If you average only a few values, the resulting values will be very "responsive" (readily reflect changes) but may be TOO noisy. If you average many values, the resulting value will tend to smooth out nicely, but it may take multiple time steps before a genuine change occurs before a genuine change is manifested in the results. There's no magic "right" answer when it comes to questions about "how much" to smooth. But, if you get it wrong, you'll be waking up when you don't really need to, or sleeping through bad stuff until it may be too late... 44
Events Per Unit Time vs. Time Between Events? Let's pretend that we're interested in a simple measure such as the number of failed ssh logins per hour. That feels very "batch- like:" collect ssh failures for an hour on the clock, then report. If the rate of failed ssh logins suddenly skyrockets, alert us so we can see who's trying to brute force us (assuming we haven't just auto-banned those attack sources with a tool such as fail2ban) Moving from a batch mentality (events per unit time, where the unit time effectively determines the size of a "batch") requires us to re-conceptualize our measurements, perhaps so that we can begin thinking about time-between-failed logins (perhaps with some sort of smoothing over multiple failures). But what if we were to simply use a sliding window for our login failures per sixty minute measurement, rather than measuring from top of the hour to top of the hour? Perhaps the difference between batch and flow is not so great after all? 45
IV. A Concrete Example of Moving Forward Toward Continuous Flow Monitoring
Let's Consider An Example... Channel 204 at the Security Information Exchange consists of "de-duplicated/filtered/verified" passive DNS data. A sample observation from Channel 204 can be seen on the following slide... 47
Sample Full Observation From Channel 204 $ nmsgtool -C ch204 -o - -c 1 [Channel 204 header omitted here] type: INSERTION count: 1 time_first: 2016-09-12 09:48:26 time_last: 2016-09-12 09:48:26 response_ip: [omitted] bailiwick: cto39.ru. rrname: cto39.ru. rrclass: IN (1) rrtype: A (1) rrttl: 3600 rdata: 88.198.154.20 Assume we're particularly interested in rdata values (as bolded) 48
An Aside: "What's RData Again?" $ dig cto39.ru [...] cto39.ru. 3600 IN A 88.198.154.20 In this example: cto39.ru is the Resource Record Name (the "left side" of that record) 88.198.154.20 is the Resource Record Data (the "right side" of that record) 49
Our Research Interest Assume we're particularly interested in the Rdata values (shown bolded above). If we were to bin the observed Rdata values by their first octet over a period of time, what might that distribution look like? Are there some /8's that are particularly busy? Are there other /8's that basically see little or nothing? As a first pass, let's do this the "batch way," and collect a million observations with the command shown on the next slide... 50


")


 Latency")

 Non-Representative Samples")


 Averaging Effects")
 Batch Size vs. Power")

 Batched Data: Data Quickly Becomes Historical")


 You Need To Learn To Throw Stuff Away...")


 You Also Need to Remember What You've Seen")
 Continuous Monitoring Never Sleeps – Will You?")