Leadership and Data: Embracing Change for Better Performance
Leadership in embracing change through data-driven decision-making is crucial for organizational success. Recognizing the need for intentional change, evaluating outcomes, and implementing improvements based on data are key aspects discussed in the provided content. The analysis of FY17 APR data trends, issues, and financial loan trends highlights the importance of understanding and adapting to changes for better program performance. Embracing change not only drives growth but also ensures sustainability in achieving desired outcomes.

Download Presentation

Please find below an Image/Link to download the presentation.
The content on the website is provided AS IS for your information and personal use only. It may not be sold, licensed, or shared on other websites without obtaining consent from the author. Download presentation by click this link. If you encounter any issues during the download, it is possible that the publisher has removed the file from their server.
E N D
Presentation Transcript
Data Update: APR, State Plan & much more . . . (including homework) Diane Cordry Golden April 2018
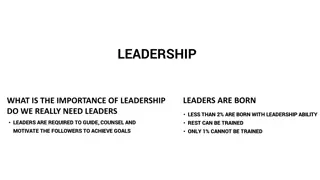
Leadership, Data & Change If you re not willing to embrace change, you re not ready to lead. Leadership demands the willingness and ability to: recognize the need for change (data) lead change celebrate outcomes (data) Performance Review APR & State Plan Data Identify Needed Improvement (data-based) Goal is intentional rather than accidental change (data). Evaluate Results (data verified) Implement Change
Topics for Today FY17 APR Data Trends and Issues + To Do s State Plan Reminders + To Do s New State Plan 2018-20 OMB Approval ACLReporting will be data submission mechanism Timeline Technical Support for ACLReporting Technical Assistance for State Plan
FY17 APR Data - Snap Shot Most activities stable or increasing numbers SFA 7,303 recipients, 10,379 devices, $13,074,980 Reuse 57,782 recipients, 74,205 devices, $29,988,784 Device Loan 37,239 borrowers, 52,374 devices Demonstration 80,096 participants, 49,056 AT types Training 125,783 participants I&A 324,688 recipients 632,891 individuals served 186,014 AT accessed/acquired $21,846,439 leveraged funding To Do: Review your data trends. Are changes intentional or accidental?
FY17 APR Reuse Reuse is exception decrease overall Recipient decrease - 8.6% Device decrease - 6.3% Savings decrease - 5.3% Data hiccup or trend? Many good explanations (ended contract with poor performing/unsafe program, decrease localized, etc.) Larger numbers is not necessarily better One grantee accounts for up to 9% of national change To Do: Review your data trend. If decreased, why? Intervention needed or not?
FY17 APR Financial Loan Trends Slow, steady shift to direct lending FY10 - 29% Direct Loans, 18% Dollars Loaned FY17 55% Direct Loans, 35% Dollars Loaned Partnership interest buy-down only down the most (always a fiscal loss to program) Likely reasons for trend Greater program control (not dictated by fiscal institution) Access to CDFI and other ongoing capital for loan fund Revenue producing - if good loans made Likely barriers to making this change Increased responsibility (servicing loans/collections) To Do: Is direct lending a fit for your program?
FY17 APR Leasing Activities Leasing - alternative to cash loans as AFP/SFA Other State Financing Activity Lease-to-own/extended payment plan (re-seller vs lender) Report as Direct Provision or Savings Use non Section 4 AT Act dollars to purchase AT Use total amount of entire payment plan as cost DO NOT use only what is paid in reporting period DO NOT report lease in multiple APRs Short-term Device Loan Non decision making Shorter-term rental (no goal of owning) Can report multiple times if separate/distinct rentals Administrative Guidance Document To Do: Leasing a consideration for your program?
FY17 APR - ICT Accessibility Training Grantees with no performance measure data FY16 13 FY17 12 Only 5 zero both years Grantees with data not meeting 70% target FY16 18 FY17 - 10 Confusion - ICT Accessibility Training vs. AT To Do: Review PM questions and data. Wrong content or 0? Implement change. (Later sessions)
FY17 APR Leveraged Funding: aka Feast or Famine Feast 8 grantees 200% or more of federal award 7 grantees 100% to 200% of federal award Range 2.8 million to $500,000 Comfortable 8 grantees 50% to 100% of federal award 8 grantees 20 % to 50% of federal award Range $500,000 to $94,000 Struggling 8 grantees 15% or less of federal award Range $75,000 to $1,000 Famine 17 grantees with no leveraged funding To Do: Later slide with State Plan Expenditures
Last Notes on APR NATADS D2D & Support Current Features Structure consistent with APR (event based) Validation rules built into individual records Stays current with any APR changes Upgraded security and accessibility Support for inventory import, training 10 hours free New Features Auto-populate from D2D to APR (target FY18) Considerations: increased automation, SFA additions To Do: Review current daily data system. Meeting needs?
State Plan Actual Expenditure Table (FY16 Award) Actual Expenditures for Closed-out Carryover Year Award Final Percentage Expenditures $ A/D at least 60% or 70% A. All State Level $ B/D no more than 40% or 30% B. All State Leadership C. Transition Training & Technical Assistance $ C/B calculate-5% or greater $ D/E calculate-should be 100% D. Total Expenditures $ E. Total Award $ [E-D] F/E calculate-should be 0% F. Lapsed Amount To Do: Complete Table. Review all revenue (grant plus leveraged) and expenditures. Identify issues, implement interventions as needed.
FY17 State Plan Implementing Agencies (Affinity Groups) State Agencies 22 Grantees 14 Vocational Rehabilitation 8 Other (Education, Health, Disability, Administration, etc.) Higher Education 20 Grantees 15 UCEDDs 5 Other (Sponsored Programs, Engineering, Medicine, etc.) Non-profit 14 Grantees 7 stand alone AT agencies 7 part of larger agency (Easter Seals, P&A, IL Organization, etc.) To Do: Take advantage without being taken advantage of more later session and Affinity Groups
State Plan Program Structure Matrix Who conducts each activity? (Organizational structure?) State, Other (usually sub-agreements), or Both Not about location Centralized Organizational Structure (mostly in-house ) Operations/Programs/Services within one unified structure Traditional hierarchy for staff organization, line authority, decision-making Staff may or may not be located together (not about location) Decentralized Organizational Structure (mostly outsourced ) Operations/Programs/Services dispersed across multiple autonomous units Units can be separate agencies/organizations, connect by agreements Unit has decision-making authority for staff, resources, program operation Where conducted? (This is about location.) Central, Regional, or Both To Do: Understand current structure change needed? (Much more in later session)
Questions/Contact CATADA (data technical assistance) Diane Golden diane.golden@ataporg.org CATADA (NATADS technical support) Vance Dhooge vance.dhooge@ataporg.org CATADA (web portal) Daria Doman Daria.Domin@umb.edu