Understanding System Reliability in Engineering

System Reliability in Science/Engineering involves understanding how products/systems work, as well as the ways they fail and the effects of failures. Reliability is the probability that a system will perform as expected under given conditions and play a crucial role in the design phase to mitigate failures and optimize lifecycle costs. The failure patterns, series and parallel system models, and reliability analysis methods discussed provide insights into ensuring high reliability and maintainability of systems.

Download Presentation

Please find below an Image/Link to download the presentation.
The content on the website is provided AS IS for your information and personal use only. It may not be sold, licensed, or shared on other websites without obtaining consent from the author. Download presentation by click this link. If you encounter any issues during the download, it is possible that the publisher has removed the file from their server.
E N D
Presentation Transcript
System Reliability Resit Unal Engineering Management & Systems Engineering Dept. Old Dominion University runal@odu.edu Slide 1
System Reliability Science/Engineering is concerned with how products/systems work, but also need to understand, The ways in which they fail, effects of failures, & aspects of design which affect the likelihood of failure. Slide 2
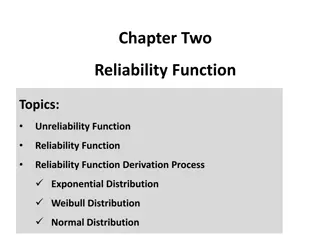
Defining Reliability Reliability is the probability that a system will perform as anticipated under given operating conditions. It can predict the probability that a system will operate for a specified # of hours or, Average time between failures (MTBF) Slide 3
System Lifecycle Costs (LCC) 70-80% of LCC are committed during design phase Design fixes how system will be operated, maintained Reliability is major cost driver (Failures, repair, lost time, redesign..) Reliability and Maintainability must be designed in. Slide 4
Failure Patterns: Bathtub Curve (t) Failure Rate Decreasing Constant (Random Failure) Increasing Failure (t) (t) Wear-out Useful Life Burn-In time Slide 5
Series System Model 0.95 0.80 R1 R2 Rss = i kRi Rss = (0.95)(0.80) = 0.76 For series systems, high reliability of components/subsystems are required. Slide 6
Parallel System Model (Redundant) Two Component System 0.85 R1 RPS =R1 + R2 -R1 R2 R1 = R2 = 0.85 R2 0.85 RPS = 0.98 ?(1 ??) RPS = 1 - ? Active redundancy: Reliability increases Slide 7
System Reliability Analysis Methods Fault Tree Analysis Failure Modes, Effects and Criticality Analysis (FMEA / FMECA) Slide 8
Fault Tree Analysis: Uses Logic Operators Emergency cooling to a nuclear reactor Coolant Sys Fails pc= 0.000903 Both Subsys Fail pvs= 0.000888 Reservoir Dry Signal Fail pps=0.00001 pr=0.000005 Pump/Valves Fails Pump/Valves Fails ppv= 0.0298 ppv= 0.0298 Pump Fails Both Valves Fail Pump Fails Both Valves Fail pp= 0.02 pvs= 0.01 pp= 0.02 pvs= 0.01 Valve Fails Valve Fails Valve Fails Valve Fails pv= 0.1 pv= 0.1 pv= 0.1 pv= 0.1 Slide 9
FMEA / FMECA List: Failure Modes Causes of failure Possible Effects Probability of Occurrence Criticality Possible Action FMECA Handbook of Reliability Engineering and Management Slide 10
Maintained Systems I. Preventive Maintenance: Performed before Failure Occurs Measure: Resulting Increase In Reliability I. Corrective Maintenance: Performed after Failure Occurs (Repair) Measure: Availability: The probability that system will be operational when needed. Slide 11
Maintained Systems Maintenance Issues Cost Safety Time to repair variability Prob. of Maintenance Introducing Failure Human Reliability Repair Times are more variable than failure rates of hardware Slide 12
Preventive Maintenance WEIBULL m < 1 WEIBULL m > 1 EXPONANTIAL CFR time DON T DON T DO LEAVE IT ALONE Slide 13
Corrective Maintenance (Repair) MAINTAINABILITY: Is a measure of how fast a system may be repaired after a failure (MTTR) AVAILABILITY: The probability that a system is available for use at a given time (the fraction of time a system is in an operational state) MTTF MTTF+MTTR A= Slide 14
Robust Design Involves making system design insensitive to variations in the input Small variations in input can result in large variations in output leading to unexpected performance loss. Optimize to reduce variability Slide 15
Y Robust Design Yo Y1 X Phadke, Quality Engineering Using Robust Design, 1990) Slide 16
Robust Design Using Design of Experiments X1j X1j Input Parameters (Xij) Process / System (Experiment) Y Output Performance Characteristics X1j Y = b0+ bixi+ bijxij+ biixi2 Ys = c0+ cixi+ cijxij+ ciixi2 Slide 17
Design of Experiments Can be utilized to study Model the effect of inputs on performance (output) Capture variability ( ) in design Design trade off studies Minimize Ys Subject to Y Slide 18
Work in Progress SOS Reliability Analysis (with Keating) System Reliability & Maintainability Analysis System Cost Analysis Robust design, DOE 19 19


")


")


")