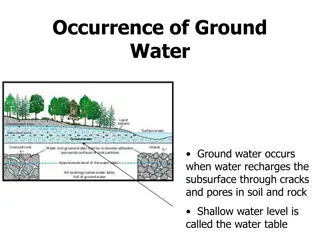
Review on Wells and Consumptive Use Assumptions

This review focuses on projections and assumptions related to permit-exempt wells, growth rates, and baseline consumptive use in subbasins. Historical growth rates from 1999 to 2018 are analyzed to forecast future well connections. Growth allocation within subbasins is based on buildable lands analysis. Baseline consumptive use assumptions for indoor and outdoor activities are detailed. The analysis also includes an average outdoor irrigation area assessment based on a selected parcel pool.

Download Presentation

Please find below an Image/Link to download the presentation.
The content on the website is provided AS IS for your information and personal use only. It may not be sold, licensed, or shared on other websites without obtaining consent from the author. Download presentation by click this link. If you encounter any issues during the download, it is possible that the publisher has removed the file from their server.
E N D
Presentation Transcript
PE Wells and Consumptive Use Review on assumptions and remaining questions
Growth Projection Methods Develop historical growth rates of permit-exempt wells for each subbasin using the TPCHD well database (1999 2018). Forecast growth of future permit-exempt well connections for the 20 year planning horizon, based on the subbasin-specific historical growth rate.
PE Well Projections: High/Low/Moderate Projected 2038 Total Wells Added Since 2018 Based on 1999- 2018 Growth Rates (moderate) Based on 1999- 2008 Growth Rates (high) Based on 2009- 2018 Growth Rates (low) Subbasins All Subbasins 227 78 145 Clover Creek 220 76 141 Sequalitchew Chambers Creek -- 7 -- 2 -- 4
Allocate growth within each subbasin spatially, based upon buildable lands analysis (i.e. parcel must be outside of UGA, not in a water & wastewater system boundary, not already build upon, or must have zoning category that allows for domestic dwelling unit use).
Baseline Consumptive Use Assumptions Indoor: 60 gal/day/pp 2.5 people per household 10% consumptive Outdoor: 20.3 inches/year (Washington Irrigation Guide) 75% irrigation efficiency 80% consumptive ?? Average landscape area
Average Landscape Area Analysis Parcel pool: 137 (from well permits between 1999-2018) Selected 80 parcels in stratified random draw by property value (<$350, $350-$600, >$600) 80 parcels was based on time, budget, and the contract, not a scientifically- based sample size. One GIS analyst reviewed the August 2018 aerial photos for signs of outdoor irrigation, and measured the irrigated area. When 2018 aerial photos were inconclusive, the analysts used other years aerial photo as noted on the CU Calculator Irrigated Area tab. Analysis yielded an average outdoor irrigation area of 0.15 acres.
Annual Consumptive Use Estimates Preliminary based on 0.15 average acres. Projec ted PE Wells Water System Estimate Outdoor Irrigation Area Growth Projection Scenario/Subbasin Ac-ft gpm cfs Ac-ft gpm cfs Based on 1999-2008 - Higher Growth Projection Clover Creek Sequalitchew Chambers Total based on 1999-2008 220 13.1 0.0 0.4 8.1 0.0 0.3 0.02 0.00 0.00 0.02 cfs 63.2 0.0 2.0 39.2 0.0 1.2 0.09 0.00 0.00 7 227 13.5 ac-ft 8.4 gpm 65.2 ac-ft 40.4 gpm 0.09 cfs Based on 2009-2018 - Lower Growth Projection Clover Creek Sequalitchew Chambers Total based on 1999-2008 76 4.5 0.0 0.1 2.8 0.0 0.1 0.01 0.00 0.00 0.01 cfs 21.8 0.0 0.6 13.5 0.0 0.4 0.03 0.00 0.00 2 78 4.6 ac-ft 2.9 gpm 22.4 ac-ft 13.9 gpm 0.03 cfs Based on 1999-2018 - Growth Projection Clover Creek Sequalitchew Chambers Total based on 1999-2008 141 8.4 0.0 0.2 5.2 0.0 0.1 0.01 0.00 0.00 0.01 cfs 40.5 0.0 1.1 25.1 0.0 0.7 0.06 0.00 0.00 4 145 8.6 ac-ft 5.3 gpm 41.7 ac-ft 25.8 gpm 0.06 cfs
Statistic PE Parcel Sample Pool Sample Size Mean with 0's SD with zero's Mean with 0.05 acre substitution SD with 0.05 acre substitution No Non-detects, Non-parametric Distribution 95% UCL (Chebyshev) Assume 0's are non-detects, replaced with 0.05 acres; Parameteric (Gamma or Lognormal) 95% UCL 0.27 Sample Size Required to Estimate Mean at a specified allowable error margin (with given SD) 0.01 acres 3,694 0.02 acres 925 0.03 acres 413 0.04 acres 233 0.05 acres 150 0.06 acres 105 WRIA 10 978 80 0.17 0.31 0.20 0.30 WRIA 12 137 80 0.15 0.22 0.17 0.21 WRIA 13 7,271 80 0.06 0.12 0.10 0.10 WRIA 14 5,091 80 0.07 0.15 0.10 0.14 WRIA 15 8,987 80 0.08 0.13 0.11 0.11 0.34 0.27 0.12 0.14 0.14 0.21 0.11 0.13 0.12 1,862 467 209 119 77 54 556 141 64 37 25 19 867 219 98 56 37 26 652 165 75 43 28 20
Questions/Concerns: Sample Size The 80 parcel sample was selected based on budget and time considerations, not necessarily statistical significance. Options to address: Document assumptions in the technical memo and plan. Compare sample size to power analysis results. Use the 95% Upper Confidence Level or add the allowable error margin (0.05) to the 0.15 acre average.
Questions/Concerns: Non-Detects The average landscape area analysis yielded many non-detects or zero irrigated areas. This does not mean that these homes do not use outdoor water. Options to address include: Assume the zeros are correct. Make changes on results from cross-WRIA analysis. Assume that there is undetectable amount of outdoor water use, and assign a value to reflect outdoor watering. Could use the high-end of the error margin (0.05 acres). Could assume average outdoor water use based on water system data. Calculate area based on the acres the average outdoor water could irrigate to WAIG standards.
Outstanding Concerns Climate change could increase evapotranspiration and irrigation requirements. Look at seasonality of water use or month by month instead of by full year. Quality control.