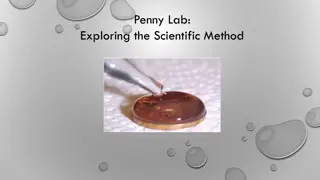
The Significance of the Scientific Method in Research

The scientific method is a crucial universal process that guides scientists in exploring observations and answering questions through a set of sequential steps. It starts with asking a question, conducting research, stating a hypothesis, designing and conducting an experiment, collecting data, and forming a conclusion. The method's universality ensures consistency and reliability in scientific investigations, leading to accurate and credible findings.

Download Presentation

Please find below an Image/Link to download the presentation.
The content on the website is provided AS IS for your information and personal use only. It may not be sold, licensed, or shared on other websites without obtaining consent from the author. Download presentation by click this link. If you encounter any issues during the download, it is possible that the publisher has removed the file from their server.
E N D
Presentation Transcript
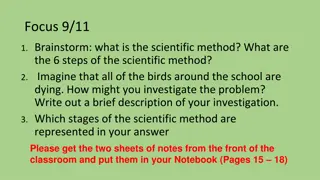
Warm-Up 7/27/2015 The Scientific Method is a universal process for experimentation that is used to explore observations and answer scientific questions. Why is it important that the scientific method be universal?
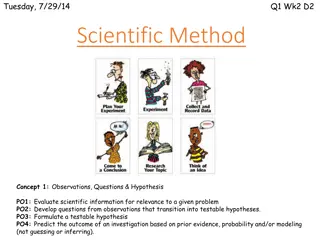
What is the SCIENTIFIC METHOD? A set of sequential steps that scientists invariably follow to answer scientific questions. 1. Ask a Question or State a Problem 2. Conduct Research 3. State a Hypothesis 4. Design and Conduct Experiment 5. Collect Data 6. Form a Conclusion
1. Ask a Question or State a Problem Ask a question or develop a problem that can be solved through experimentation. 1 o clock = Here sits a young man in a thinking session pondering the World crisis.
2. Conduct Research Conduct research for your topic of interest. 2 o clock = Over here is a young girl searching for a prom date on a computer on Facebook sorting through the jerks, trying to find the right one.
Types of Research/Information: Qualitative: Data that cannot be counted. It is usually grouped by characteristics and is subjective information. Quantitative: Data that can be counted and sorted based on numbers. This is objective information.
3. State a Hypothesis Predict a possible answer to the problem or question. State a hypothesis. 3 o clock = Over here in the state of North Dakota at a zoo is a hippopotamus looking forward to warmer weather in the summer.
Hypothesis: a testable explanation for a problem or question. Stated as if______, then_________.
The hypothesis is directly related to the dependent and independent variables. Hypothesis: If fertilizer is applied to plants, then the plants will stop growing. Independent: Fertilizer application Dependent: Plant growth Constants: Type of plant, environment (water, sunlight, soil)
Hypothesis: If Bt corn is exposed to ECB, then the Bt corn will produce higher corn yields than traditional corn varieties. Independent variable: Bt corn Dependent variable: corn yields Constants: EBC infestation
Hypothesis: If I do this (independent variable), then this will happen (dependent variable) Independent Variable: What you will change Dependent Variable: What you will measure * The measurement should DEPEND on what you changed (independent variable)
4. Design & Conduct Experiment Set up and conduct an experiment 4 o clock = A new train conductor sucking on a peppermint testing his locomotive.
To Design An Experiment ,You Need to Identify Independent Variable: (what you want to test/change) Dependent Variable: (what you want to measure) Control Group: How will you know the independent variable caused a change in the dependent variable? Experimental Group: Group tested. All conditions are kept the same EXCEPT the independent variable.
What Are Our Constants? Factors that are kept the same and not allowed to change. It is important to control all, but one variable at a time to be able to interpret data.
Replications- Conduct several trials or replications The more replications, the better we can conclude that our data and findings are due to changes in the independent variable rather than chance (error).
5. Collect Data Collect quantitative and qualitative data obtained from the experiment 5 o clock = The Easter bunny is preparing for the big day by collecting eggs laying them out on a table labeling each one with a date insuring they will be fresh.
Collect Data: Quantitative: Report in quantity/numbers SI: International System of Measurement Length in meters Mass in grams Volume in liters Time in seconds Temperature in Celsius degrees Qualitative: Reports as descriptions
6. Form a Conclusion Form a Conclusion. Decide if your data either supported your hypothesis or did not 6 o clock = A magician looks at all that have gathered before him and alludes it s all an illusion.