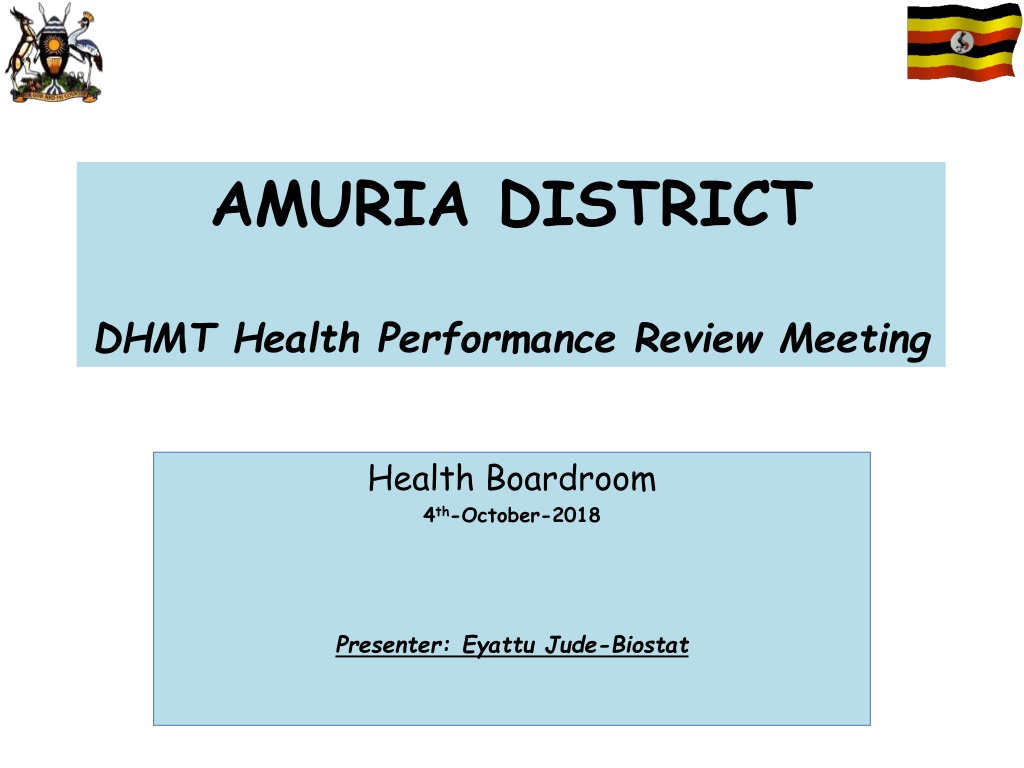
Health Performance Review Meeting in Amuria District DHMT
Eyattu Jude, the Biostat presenter, conducted a Health Performance Review Meeting in the Amuria District Boardroom on October 4th, 2018. The meeting discussed the rationale, methodology, challenges, and the way forward for various health services such as OPD, IPD, Malaria, CH, MH, HIV/AIDS, and HRH. Data analysis, SOPs, guidelines, and frameworks were key components of the review, focusing on achieving HSDP targets. The meeting also highlighted disease burdens, nutritional status, and service delivery in the district.

Download Presentation

Please find below an Image/Link to download the presentation.
The content on the website is provided AS IS for your information and personal use only. It may not be sold, licensed, or shared on other websites without obtaining consent from the author. Download presentation by click this link. If you encounter any issues during the download, it is possible that the publisher has removed the file from their server.
E N D
Presentation Transcript
AMURIA DISTRICT DHMT Health Performance Review Meeting Health Boardroom 4th-October-2018 Presenter: Eyattu Jude-Biostat
Content Rationale & methodology Health Service Performance [OPD, IPD, Malaria, CH, MH, HIV/AIDS, HRH, Ranking ] Challenges Way Forward
Rationale & methodology Requirement: SOPs, guidelines, Frameworks, policies Mandate: HSDP Analysis: Quarterly comparative analysis, FY 17/18 METHODOLOGY RATIONALE Data: Secondary; HMIS system Compass: Decision making Targets: HSDP, District based Indicators:<20%, Max of 2 per service area, 6 service areas
OPD Service Delivery Amuria: OPD Percapita: FY 2017/2018 1.20 1.00 0.80 OPD Percapita 0.60 0.40 0.20 0.00 QRT-1 1.11 1 QRT-2 1.03 1 QRT-3 0.81 1 QRT-4 1.08 1 FY 1.01 1 OPD Percapita Target
OPD Service Delivery cont Amuria: OPD Attendance by age Category: FY 17/18 Amuria: Total attendance by sex and age category: FY 17/18 151296 73% 74475 2838230890 12084 11254 449 388 19% 8% 0% 0-28 Days 29 Days-4 Years 5-59 Years >=60 Years Total attendance
OPD Disease burden: FY 2017/2018 Condition/illness/disease # cases Disease burden Rank Sexually Transmitted Infections 3,939 1.13% 10 Pneumonia 4,007 1.15% 9 Eye Conditions 4,426 1.27% 8 Diarrhoea-Acute 8,344 2.39% 7 Skin Diseases Gastro-Intestinal Disorders (non- Infective) Intestinal Worms 9,306 2.67% 6 14,144 4.06% 5 14,952 4.29% 4 Urinary Tract Infections (UTIs) 42,844 12.29% 3 No Pneumonia - Cough or Cold 54,988 15.77% 2 Malaria 120,025 34.42% 1
Nutritional Status Amuria; Nutritional Status by age Category; FY 2017/18 14000 12000 10000 8000 6000 4000 2000 0 Severely Underweight (BMI<16) Underweight (16<=BMI <18.5) Normal (18.5<= BMI <=25) Over weight (25<BMI <=30) Obese (BMI>30) 5-10 Years 11-18 Years >18 Years
Nutritional Status cont.. Amuria; Overall Nutrition Status; FY 2017/18 90.9% 3.8% 3.2% 1.7% 0.4% Severely Underweight (BMI<16) Underweight (16<=BMI <18.5) Normal (18.5<= BMI <=25) Over weight (25<BMI <=30) Obese (BMI>30)
Risky behaviours Amuria; Alcohol and Tobacco Use; FY 17/18 Male, 10-19 Years Male, 20-24 Years Male, >=25 Years Female, 10- 19 Years Female, 20- 24 Years Female, >=25 Years R1-Alcohol use R2-Tobacco use
Risky behaviours cont.. Amuria; Alcohol & Tobacco use; FY 17/18 10-19 Years 20-24 Years >=25 Years R1-Alcohol use R2-Tobacco use
Inpatient Service Delivery # District admitted 26,412 on its 385 beds 189 patients are admitted in District wards monthly on average Beds under utilized with BOR of < half: HSDP target is 90% Admissions Deaths Patient Days AVG Wards Beds BOR (%) Occupancy Male medical ward 44 2349 18 5848 16 36.5% Female medical ward 59 4153 9 9530 27 44.5% Pediatrics ward 80 4439 16 13208 37 45.5% Maternity/Obstetric ward 118 9956 2 23972 66 55.8% General Ward 85 5515 23 16227 45 52.2% District 385 26412 68 68785 189 48.9%
Surgical Procedures Performed Major Procedure Caesarian sections Obstetric fistula repair Laparotomy Tracheostomy Evacuations (incomplete abortion) Internal fixation Neuro Surgery (Burr hole) Thoracotomy Cardiothoracic surgery Orthopedic Surgery Occular Surgery ENT surgical procedures Herniorrhaphy Plastic/ reconstructive surgery Other Major procedures Total Number of Major Operations # 314 0 50 0 340 0 0 0 0 0 0 0 41 0 175 920 % % Minor Procedure # 34% 0% 5% 0% 37% 0% 0% 0% 0% 0% 0% 0% 4% 0% 19% 0% Oral surgery 0 Debridement and care of wounds and skin grafting 3% 17 36% Incision and drainage of abscesses 210 2% Ocular surgery 9 0% Minor Orthopedic Surgery 1 0% Minor ENT surgical procedures 0 6% Safe Male Circumcision 37 54% Other Minor procedures 317 Total Number of Minor Operations 591
IPD Disease Burden Inpatient Disease Burden- Percent Disease/illness/Condition # Cases Malaria total 8309 41.3% Urinary Tract Infections (UTI) 2308 11.5% Pneumonia 1142 5.7% Respiratory Infections (Other) 811 4.0% Anaemia 638 3.2% Gastro-intestinal disorders (non-infective) 526 2.6% Diarrhoea Acute 489 2.4% Injuries: (Trauma due to other causes) 247 1.2% Septicemia 223 1.1% Injuries: Road Traffic Accidents 216 1.1%
Case Fatality Rate Data element Cardiac arrest Diabetes mellitus (newly diagnosed cases) Stroke Liver Cirrhosis Diabetes mellitus (re-attendances) Hypertension (Old cases) Attempted Suicide Neonatal Sepsis 8-28days Epilepsy Anaemia Asthma Poisoning Respiratory Infections Pneumonia Injuries: Road Traffic Accidents Diarrhoea - Acute Gastro-intestinal disorders (non-infective) Malaria Case 4 6 9 14 16 82 37 21 27 638 133 61 811 1142 216 489 526 8309 Death 3 2 2 1 1 5 2 1 1 15 3 1 8 6 1 1 1 15 CFR (%) 75.00% 33.33% 22.22% 7.14% 6.25% 6.10% 5.41% 4.76% 3.70% 2.35% 2.26% 1.64% 0.99% 0.53% 0.46% 0.20% 0.19% 0.18%
Malaria Amuria; Malaria Lab Diagnosis; FY 2017/18 96% 92% 89% 100% 89% 89% 88% 85% 90% 80% 70% 61% 60% Percent 50% 40% 30% 11% 12% 20% 11% 8% 10% 0% Jul to Sep 2017 Oct to Dec 2017 Jan to Mar 2018 Period Apr to Jun 2018 % Confirmed Malaria Cases % Tests by RDT % Tests by Microscopy
Malaria cont Amuria District; Weekly Malaria Cases; EPI WKS 1-52, 2017 10000 9000 8000 7000 6000 No. Malaria Cases 5000 4000 3000 2000 1000 0 2015W11 2015W20 2015W22 2015W23 2015W24 2015W25 2015W26 2015W27 2015W28 2015W29 2015W30 2015W32 2015W33 2015W34 2015W35 2015W36 2015W37 2015W38 2015W39 2015W40 2015W42 2015W43 2015W44 2015W45 2015W46 2015W47 2015W48 2015W49 2015W50 2015W52 2015W10 2015W12 2015W13 2015W14 2015W15 2015W16 2015W17 2015W18 2015W19 2015W21 2015W31 2015W41 2015W51 2015W1 2015W2 2015W3 2015W4 2015W5 2015W6 2015W7 2015W8 2015W9 2017 AVG AVG+2SD
Immunization Coverage Period Antigen Jul to Sep 2017 Oct to Dec 2017 Jan to Mar 2018 Apr to Jun 2018 FY 2017/18 BCG DPT-HepB+Hib 1 DPT-HepB+Hib 2 DPT-HepB+Hib 3 Fully immunized by 1 year Measles PCV 1 PCV 2 PCV 3 Polio 0 Polio 1 Polio 2 Polio 3 Protection At Birth (PAB) Rotavirus 1 Rotavirus 2 Rotavirus 3 104% 108% 103% 103% 78% 84% 105% 99% 105% 88% 106% 101% 99% 50% 0% 0% 0% 97% 117% 108% 108% 91% 94% 109% 105% 105% 81% 112% 105% 107% 49% 0% 0% 0% 93% 108% 103% 111% 83% 91% 106% 101% 107% 71% 95% 88% 98% 55% 0% 0% 0% 105% 101% 99% 101% 83% 90% 102% 98% 100% 81% 97% 95% 95% 64% 11% 2% 0% 100% 109% 103% 106% 84% 90% 106% 101% 104% 80% 103% 97% 100% 54% 3% 1% 0%
RED/REC Categorization Criteria DPT1 coverage 90% Drop-out Rate 10% AMURIA DISTRICT, ANNUAL REPORT (JULY 2017 - JUNE 2018) Goal : Increase immunization coverage to at least 90% with all vaccines in every district Compile population, immunization coverage data in previous 12 months Prioritize area Area Name Analyse Problem Categoriz e problem according to table 2** Target Population Doses of vaccine administred Immunization coverage (%) Unimmunized (No.) Drop-out (rates (%) Identify problem (see table 2*) S/County Population DPT1- DPT3 DPT1- Measles AccessUtilizatio Category 1,2,3, or 4 Priority 1,2,3,,, 4 DPT1 DPT3 Measles DPT1 DPT3 Measles DPT3 Measles n a b c d e f g h i j k l m n o p 1 ABARILELA AKERIAU TOWN COUNCIL APEDURU ASAMUK KUJU MORUNGATUNY OGOLAI ORUNGO WERA WILLA ACOWA KAPELEBYONG OBALANGA OKUNGUR District Average 27,903 16,010 8,009 15,740 24,357 20,528 19,697 16,008 16,783 27,123 15,263 41,389 22,141 20,752 14,997 306,700 1,200 688 344 677 1,047 883 847 688 722 1,166 656 1,780 952 892 645 1,036 554 1,026 745 800 619 757 993 478 1,332 521 1,575 2,062 1,147 691 14,336 1,015 567 1,039 686 794 627 748 848 453 1,284 561 1,512 2,043 973 794 13,944 980 426 959 298% 302% 467 110% 101% 776 76% 604 70% 695 89% 761 144% 123% 434 66% 985 114% 110% 473 79% 1,319 88% 1,624 217% 215% 710 129% 109% 602 107% 123% 11,815109%106% 86% 80% 85% 82% 82% 62% 278% 69% 74% 68% 82% 111% 60% 84% 72% 74% 171% 80% 93% 90% -756 185 121 -695 220 262 -615 210 271 279 152 -73 288 181 183 461 -672 182 43 1373 2% -2% -1% 8% 1% -1% 1% 15% 5% 4% -8% 4% 1% 15% -15% 3% 5% 23% 7% Good 37% Good 3% 2% 8% 23% Good 9% 26% Good 9% 16% 21% Good 38% Good 13% Good 18% Good Poor Poor Good Poor Poor Good Good Poor Good Poor Good Good Poor Good Good Poor Poor Good Cat. 3 Cat. 4 Cat. 2 Cat. 1 Cat. 3 Cat. 4 Cat. 3 Cat. 2 Cat. 3 Cat. 1 Cat. 4 Cat. 3 Cat. 1 Cat. 2 Cat. 2 Cat. 1 1, 2 2 -9 76% 71% 88% 253 256 99 -160 269 -118 95 268 -1091 -81 -149 Poor Poor Poor 1 1, 2 1 2 1 63% Poor 85% 85% Poor Poor 1,2 1 2 2 13,188
Integrated Child Health Days Targets never been met 148443 74381 73792 58886 21341 17623 3817 3553 3298 2146 Jul to Sep 2017 Oct to Dec 2017 Jan to Mar 2018 Apr to Jun 2018 Children Dewormed Children Given Vit-A Deworming Target [48.4%] Vit-A Supplementation Target
Antenatal Care Selected ANC Key Indicator Pregnant women tested for syphilis Pregnant women tested positive for syphilis Pregnant Women re-tested later in pregnancy (TR+ &TRR+) Pregnant Women testing HIV+ on a retest (TRR+) ANC 1st Visit for women ANC 1st Visit for women (No. in 1st Trimester) HIV+ Pregnant Women initiated on Cotrimoxazole ANC 4th Visit for women ANC 4+ visits for Women ANC Referrals from unit(Total) ANC Referrals from unit(To FSG) First dose IPT (IPT1) Second dose IPT (IPT2) Pregnant Women receiving Iron/Folic Acid on ANC 1st Visit Pregnant Women receiving free LLINs HIV+ Pregnant Women initiated on ART for EMTCT (ART) Pregnant Women newly tested for HIV this pregnancy(TR & TRR) Pregnant Women tested HIV+ for 1st time this pregnancy (TRR) at any visit HIV+ Pregnant women assessed by CD4 Male partners received HIV test results in eMTCT(Total) Pregnant Women who knew status before 1st ANC (Total (TRK + TRRK)) HIV+ Pregnant women assessed by WHO clinical staging only Male partners received HIV test results in eMTCT(HIV+) Cov (%) 26% 1% 45% 0% 89% 17% 100% 26% 8% 0% 0% 82% 73% 85% 37% 82% 87% Comment 1% 20% 64% 5% 59% 2%
Maternity Comment Selected Maternity Key Indicator Admissions Babies Born with low birth weight (<2.5Kgs) Babies born with defect Birth Asyphyxia Born Before Arrival HIV+ women initiating ART in maternity Live babies HIV-exposed babies given ARVs Maternity referrals out Mothers given Vit A supplementation Newborn deaths (0-7days) No. of babies who received PNC at 6 hours Total 11324 318 67 209 64 9 6855 220 655 4136 31 6916 Cov (%) 74% 5% 1% 3% 1% 100% 87% 76% 6% 53% 0% 88% No. of mothers who initiated breastfeeding within the 1st hour after delivery (No.HIV+) 76% 220 51% 3% 1% 2% Deliveries in unit Deliveries to HIV+ women in unit(Total) Deliveries in unit(Fresh Still births) Deliveries in unit (Pre-Term births ) 7863 251 49 128
OVERALL YIELD IN HTS IN AMURIA DISTRICT Amuria; HTS Yield Trend 4.00% 3.50% 3.00% 2.50% HTS Yield 2.00% 1.50% 1.00% 0.50% 0.00% Oct-Dec, 2017 1.15% 3.70% Jan-Mar,2018 1.02% 3.70% Apr-June, 2018 1.24% 3.70% Achieved Target
HTS PROGRESS AGAINST TARGET OCT 2017- SEPT 2018 FACILITY TARGET HIV POSITIVE HTS ACHIEVED AS OF JUNE 2018 % PROGRESS 1382 122 55 128 165 38 80 202 40 Amuria District 694 50.2% Abarilela HC III 64 52.5% Ongutoi HC III 44 80.0% Acowa HC III 62 48.4% Amuria HC IV 91 55.2% Amucu HC III 16 42.1% Asamuk HC III 55 68.8% Kapelebyong HC IV 34 16.8% St. Francis Acumet HC III 21 52.5% 83 90 188 Morungatuny HC III 25 30.1% Obalanga HC III 43 47.8% Ococia (Orungo) St. Clare HC III 83 44.1% 64 43 85 Orungo HC III 41 64.1% St. Michael Wera HC III 18 41.9% Wera HC III 30 35.3%
TX_NEW PROGRESS AGAINST TARGET OCT 2017-SEPT 2018 FACILITY TARGET(STARTED ON ART) ACHIEVED AS OF JUNE 2018 % PROGRESS Amuria District Abarilela HC III Acowa HC III Amucu HC III Amuria HC IV Asamuk HC III Kapelebyong HC IV Morungatuny HC III Obalanga HC III Ococia (Orungo) St. Clare HC III Ongutoi HC III Orungo HC III 1341 96 173 24 230 82 180 19 80 286 21 35 483 44 62 11 82 46 47 18 31 69 27 32 36.0% 45.8% 35.8% 45.8% 35.7% 56.1% 26.1% 94.7% 38.8% 24.1% 128.6% 91.4% St. Francis Acumet HC III 31 9 75 21 13 24 67.7% 144.4% 32.0% St. Michael Wera HC III Wera HC III
ON ART PROGRESS AGAINST TARGET OCT 2017-SEPT 2018 FACILITY TARGET(STARTED ON ART) ACHIEVED AS OF JUNE 2018 % PROGRESS Amuria District Abarilela HC III Acowa HC III Amucu HC III Amuria HC IV Asamuk HC III Kapelebyong HC IV Morungatuny HC III Obalanga HC III St. Clare HC III Ongutoi HC III Orungo HC III St. Francis Acumet HC III St. Michael Wera HC III Wera HC III 5791 415 748 103 993 352 777 84 344 1237 90 153 134 37 324 5312 388 690 126 848 367 676 118 358 986 99 168 156 49 283 91.7% 93.5% 92.2% 122.3% 85.4% 104.3% 87.0% 140.5% 104.1% 79.7% 110.0% 109.8% 116.4% 132.4% 87.3%
VL SUPPRESSION: OCT 17-SEPT 2018 FACILITY TARGET ACHIEVED 90% 90% 90% 90% 90% 90% 90% 90% 90% 90% 90% 90% 90% 90% 90% 82.1% 85.8% 79.4% 80.0% 83.6% 82.9% 79.3% 79.6% 82.0% 84.6% 85.9% 84.2% 83.5% 79.7% 78.7% Amuria District Abarilela HC III Acowa HC III Amucu HC III Amuria HC IV Asamuk HC III Kapelebyong HC IV Morungatuny HC III Obalanga HC III St. Clare HC III Ongutoi HC III Orungo HC III St. Francis Acumet HC III St. Michael Wera HC III Wera HC III
HRH: Absenteeism Rate: Aug 2018 S/N Facility Month and Year Absenteeism Rate (Average) Comment:[Target-0%] 1DHO'S OFFICE 18-Aug 0% 2ABEKO GOVT Health Centre II 18-Aug 6% 3ABIA Health Centre II 4AKERIAU Health Centre II 5ALERE Health Centre II 18-Aug 18-Aug 18-Aug 18% 0% 0% 6AMILMIL Health Centre II 18-Aug 3% 7AMOLO Health Centre II 8ARUTE Health Centre II 18-Aug 18-Aug 0% 0% 9OGOROKWAR Health Centre II 18-Aug 11% 10OLWA Health Centre II 18-Aug 17.3& 11ABARILELA Health Centre III 18-Aug 5% 12AMUSUS Health Centre III 18-Aug 4% 13ASAMUK Health Centre III 18-Aug 1% 14MORUNGATUNY Health Centre III 18-Aug 11% 15ORUNGO Health Centre III 18-Aug 12% 16WERA Health Centre III 18-Aug 12% 17AMURIA Health Centre IV 18-Aug 2%
The End THANK YOU