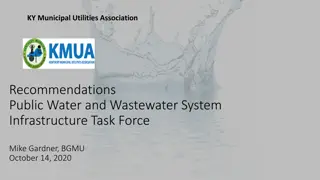
Recommendations for Improving Kentucky's Water Infrastructure

In the presentation by Greg C. Heitzman, PE, MBA, key recommendations were made to enhance Kentucky's water and wastewater infrastructure. The report card highlighted mediocre grades for drinking water (C+) and wastewater (C-), indicating the need for improvement. Efforts such as establishing regional water management councils, implementing a statewide water GIS database (KY WRIS), and promoting water system consolidation have shown success. Kentucky's water systems face challenges with aging infrastructure and lead service lines, but significant progress has been made in public water service availability and system consolidation.

Download Presentation

Please find below an Image/Link to download the presentation.
The content on the website is provided AS IS for your information and personal use only. It may not be sold, licensed, or shared on other websites without obtaining consent from the author. Download presentation by click this link. If you encounter any issues during the download, it is possible that the publisher has removed the file from their server.
E N D
Presentation Transcript
RECOMMENDATIONS FOR KENTUCKY S WATER/WASTEWATER INFRASTRUCTURE Presented by Greg C. Heitzman, PE, MBA BlueWater Kentucky Presentation to Kentucky Task Force on Water Infrastructure October 23, 2019 1
2019 Kentucky Infrastructure Report Card Mediocre Drinking Water = C+ Waste Water = C- https://www.infrastructurereportcard.org/state-item/kentucky/ 2
15 Regional Water Management Councils to coordinate planning State-wide water GIS database => KY WRIS Drinking Water coverage at 95% Water and Wastewater system consolidation KENTUCKY'S SUCCESS SINCE Water System interconnections through regional cooperation Improved compliance record in water and wastewater SB 409 Industry Collaboration through KY Water Advisory Council AUTHORIZED IN Active Industry Associations (AWWA, KMUA, KWWOA, Rural Water, etc.) 2000 Coordinated Agency Funding (KIA, RD, DLG, AML, ARC, CDBG, etc.) Training from AWWA, KDOW, RCAP, Rural Water, UK, etc. R&D support from UK, UL, WKU Partnerships among Best Practice Water/WW systems 3
KENTUCKY WATER SYSTEMS 435 Public Water Systems 213 Water Treatment Plants(average age 36 years) 1,842 Water Storage Tanks (average age 26 years) 58,783 Miles of Water Main Average age 38 years 20% over 50 years Source: KY Infrastructure Authority and KY Division of Water Estimated 25,000 lead service lines 4
PUBLIC WATER SERVICE AVAILABILITY 2000 - Governor Paul Patton s 2020 Water Vision thru Senate Bill 409 435 Kentucky Public Water Systems serve 4.5 million people 95% of Kentuckians have access to public water system (top 5 in US) Recognized nationally for regional planning and consolidation Source: KY Infrastructure Authority and KY Division of Water 5
Consolidation of KY Water Systems 80% decline in number of water systems over 45 years (one of best in US) Source: KY Division of Water 6
Kentucky Water System Profile Top 12 Systems Serve: 296 Small Systems 37 % of KY Population 54% of Water Produced 1. 2. 3. 4. 5. 6. 7. 8. 9. 10. Logan-Todd Regional Commission 11. Glasgow Water Company 12. Hardin County Water District No. 2 Louisville Water Company Kentucky-American Water Co Northern Kentucky Water District Bowling Green Municipal Utilities Owensboro Municipal Utilities Ashland Water Works Paducah Water Works Frankfort Plant Board Somerset Water Service Top 12 Large Systems Source: KY Division of Water 7
KY Drinking Water Regulations Decline in Violations last 5 years from 849 in 2014 to 546 in 2018 Increase in 2014 for Disinfection By-Product Violations DBPs have declined through 2018 with technical assistance from KY DOW and KY Rural Water Expect improvement again in 2019 Source: KY Division of Water 8
Lead Compliance Record All 435 Public Water Systems are compliant with EPA Lead and Copper Rule Proposed EPA Target Level 10 ppb Current EPA Action Level of 15 ppb Kentucky in generally in good shape if EPA sets Target Level at 10 parts per billion (ppb) EPA estimates KY has 53,000 Lead Service Lines KY estimate is less than 25,000 Lead Service Lines, since Louisville has reduced lead service line inventory from 70,000 in 1940 to less than 500 in 2019 Need State-wide Lead Inventory Source: KY Division of Water 9
KENTUCKY WASTEWATER SYSTEMS 17 Consent Decrees in KY to eliminate sewer overflows Ky Wastewater Systems have reduced sewer overflows from 5.8 billion gallons in 2003 to 3.1 billion gallons in 2018 Source: KY Division of Water 10
PUBLIC WASTEWATER SERVICE AVAILABILITY 60 percent of Kentucky s population has access to wastewater treatment plant (5% increase since 2011) Remaining 40% percent uses private wastewater systems or have illegal straight pipes to Kentucky waterways Need to eliminate straight pipe discharges Source: KY Division of Water 11
WATER AND WASTEWATER RATES Average KY Water Bill for 5,000 gallons/month 2012 - $33.77 2018 - $39.75 2.75% average annual increase (CPI about 2%) Average KY Wastewater Bill for 5,000 gallons/month 2012 - $33.68 2018 - $41.12 3.0% average annual increase (CPI about 2%) Total W/WW Bill Averages $80.87/month or $970/Year Some KY communities exceed $100 per month or $1,200/Year Averages 2% of KY Median Household Income of $48,375 Some KY communities at 2.5% of KY MHI Source: KY Rural Water/Cannon & Cannon Rate Survey 12
TOP CHALLENGES FOR WATER/WASTEWATER #1 CONTINUED COMPLIANCE WITH REGULATIONS Disinfection By-Products (DBP) in drinking water Lead and Copper Focus IS now on Lead In Schools America s Water Infrastructure Act of 2018 (AWIA) Algal Toxins and PFAS (perfluoroalkyl) substances Combined and Sanitary Sewer Overflows (CSO/SSO) Stormwater Management Nutrient loading in streams (nitrogen and phosphorus fertilizers) Pesticides and Herbicides MS4 13
TOP CHALLENGES FOR WATER/WASTEWATER # 2 AGING INFRASTRUCTURE Water - Aging treatment, storage, pumping, distribution Wastewater Aging collections, storage, treatment, pumping, flood protection Growing deferred maintenance Slow adoption of Asset Management and Life Cycle Analysis Lack of capital planning (5,10,20 years) Funding and Procurement Cycle 48 Water Main Break Flood Protection Pumps and Levees Sewer Collapse 14
TOP CHALLENGES FOR WATER/WASTEWATER #3 INFRASTRUCTURE FUNDING $8.2 Billion Funding Gap for KY Drinking Water ($1,800/person) over next 20 years Current customer rate base is not adequate to fund infrastructure needs Funding focus has been on new infrastructure and not on repair, maintenance and replacement $6.2 Billion Funding Gap for KY Wastewater ($1,400/person) Loans are replacing grants (systems waiting on grants) Limited funds available for soft costs (planning, new technology, best practice, life cycle analysis) 15
TOP CHALLENGES FOR WATER/WASTEWATER #4 CONSUMPTION & RATES Kentucky is generally a slow or no-growth economy Water consumption is declining: transition to service economy recycling/reuse low-flow plumbing fixtures therefore . fixed costs are spread over fewer gallons sold Different rate approval methods (PSC -regulated vs Municipal) Reluctance by elected officials and appointees to raise rates due to public pressure Affordability of water becomes a concern in some communities when full-cost pricing is implemented 16
TOP CHALLENGES FOR WATER/WASTEWATER #5 Water Loss KY Water Loss averages over 30 percent Inconsistent methods of measuring water loss No statewide standard practice PSC method vs municipal methods Extensive use of estimates Percent water loss not industry best practice Need economic approach to water loss ($ value of water) 17
TOP CHALLENGES FOR WATER/WASTEWATER #6 WORKFORCE Retiring Boomer workforce Projected gap in licensed operators and technical staff Non-competitive salary and benefits in robust economy State pension crisis impact on workforce and balance sheet Agency staff shortage (DOW, KIA, PSC) Changing expectations of millennial workforce Teamwork Mobility Technology 18
TOP CHALLENGES FOR WATER/WASTEWATER #7 Planning & Best Practices Lack of Business/Strategic Planning Lack of Asset Management & Capital Planning Best Practices slow to adopt Slow to adopt new technology (IoT) Outdated procurement regulations (slow/inefficient) Life cycle costing rarely evaluated 19
1. Continue Kentucky Drinking Water and Clean Water Advisory Councils. 2. Continue to enhance water planning in Kentucky required under SB 409: Improve accuracy and consistency of WRIS data Engage local Water Management Planning Councils Fully fund staff and technology resources RECOMMENDATIONS BY BLUEWATER KENTUCKY 3. Leverage federal funds with state funding (i.e. Indiana WIFIA approach). 20
4. Establish annual $50 million Kentucky Water Infrastructure Fund: To assist water/wastewater/stormwater systems in planning, engineering, design and construction Revolving loan program with up to 30% annually for grants 5. Develop Kentucky uniform water/wastewater performance criteria and rating system: Include technical, managerial and financial criteria Collaborate with industry to develop rating system and key performance metrics Develop peer review process to improve performance Recognize and award and top-rated systems Publish W/WW system ratings Take corrective action on failing water systems RECOMMENDATIONS BY BLUEWATER KENTUCKY 6. Create financial incentives (principal forgiveness) for assessing capacity and achieving performance levels in areas of: Technical - regulatory compliance/operations Finance - financial capacity, cost of service rates, audits Managerial asset management, planning, water loss, customer service, system reliability, consolidation, interconnects, risk management plans 21
7. Adopt full cost pricing of water using industry standards (AWWA M1): Adopt rate indexing to W/WW based CPI Use infrastructure surcharges to address funding gaps Use system development charges to fund growth infrastructure RECOMMENDATIONS BY BLUEWATER KENTUCKY 8. Adopt industry standard for water audits and loss control programs (AWWA M36). 9. Establish Centers for Excellence in Water through partnerships with utilities, water industry associations and academic institutions: Water quality/operations Infrastructure/asset management Water loss Finance Customer service Innovation/Best Practices in water 22
10. Conduct state-wide studies on the following: Water loss Lead service/plumbing inventory System interconnections for reliability and drought relief Affordability of water/wastewater for low/fixed income households RECOMMENDATIONS BY BLUEWATER KENTUCKY 11. Revise administrative regulations to: Define technical, managerial and financial roles for KY PSC, DOW and KIA to eliminate duplication and streamline processes Provide authority to DOW/KIA/PSC to address failing water systems (technical, managerial financial) and ability to intervene and take corrective action Establish water and wastewater rate indexing allowing annual rate adjustments. (CPI or equivalent) 12. Require water and wastewater systems to prepare 10-year Capital Improvement Plans for Asset Management and infrastructure Renewal. 23
Kentucky Division of Water Kentucky Infrastructure Authority/WRIS Kentucky Rural Water Association KY-TN AWWA ASCE Infrastructure Report Card Drinking Water 2019 ASCE Infrastructure Report Card Wastewater 2019 2018 KY Rural Water/Cannon & Cannon Rate Survey SOURCES AND REFERENCES 24
Greg C. Heitzman, PE, MBA Retired CEO Louisville Water DISCUSSION AND QUESTIONS and Louisville MSD www.bluewaterky.com 502-533-5073 25