Alternative Vapor Intrusion Screening Tools for Environmental Investigations
Estimation of subslab attenuation factors for vapor intrusion investigations is crucial in assessing indoor air quality. This study reviews EPA methods, emphasizing the importance of vapor attenuation in screening indoor air for contaminants. Various experts contributed insights, leading to the development of effective screening tools for evaluating vapor intrusion risks.
- Vapor intrusion
- Screening tools
- Environmental investigations
- Indoor air quality
- Subslab attenuation factors

Uploaded on Sep 29, 2024 | 0 Views
Download Presentation

Please find below an Image/Link to download the presentation.
The content on the website is provided AS IS for your information and personal use only. It may not be sold, licensed, or shared on other websites without obtaining consent from the author. Download presentation by click this link. If you encounter any issues during the download, it is possible that the publisher has removed the file from their server.
E N D
Presentation Transcript
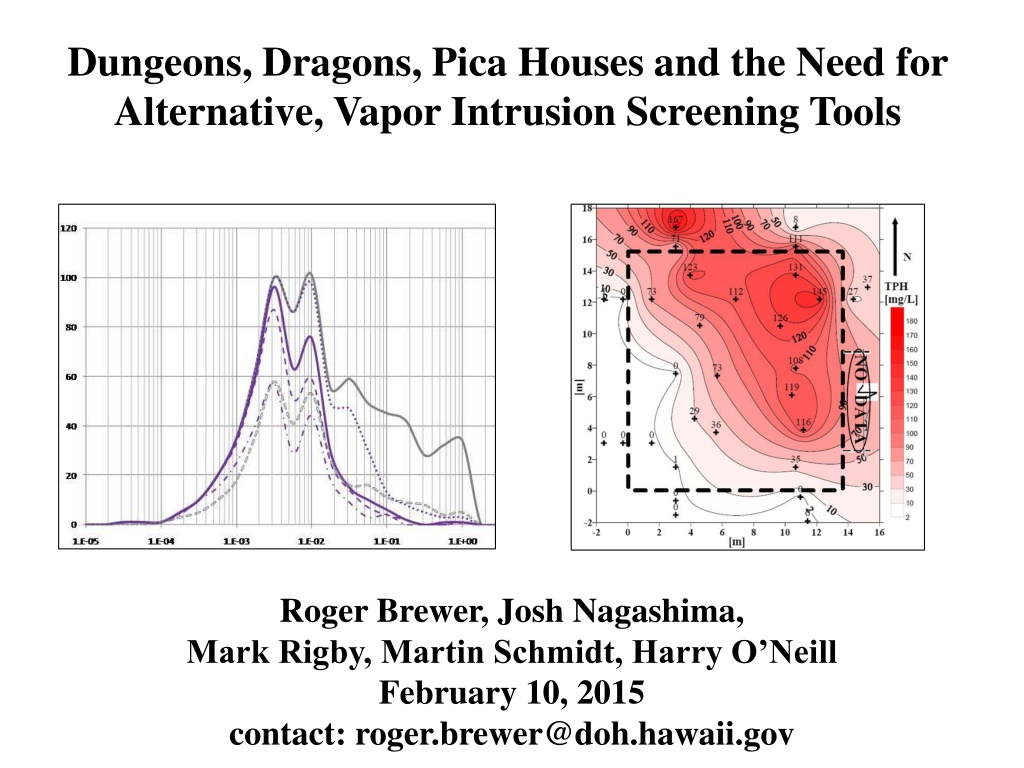
Dungeons, Dragons, Pica Houses and the Need for Alternative, Vapor Intrusion Screening Tools Roger Brewer, Josh Nagashima, Mark Rigby, Martin Schmidt, Harry O Neill February 10, 2015 contact: roger.brewer@doh.hawaii.gov
Reference Brewer, R., Nagashima, J., Rigby, M., Schmidt, M. and O'Neill, H. (2014), Estimation of Generic Subslab Attenuation Factors for Vapor Intrusion Investigations. Groundwater Monitoring & Remediation, 34: 79 92. http://onlinelibrary.wiley.com/doi/10.1111/gwmr.12086/full Roger Brewer & Josh Nagashima: Hawai i Dept of Health State vapor intrusion guidance Mark Rigby: Parsons Corporation, UC Santa Barbara Toxicology, risk assessment, vapor intrusion Martin Schmidt: Cox-Colvin and Associates, Inc. Vapor intrusion field investigations, Vapor Pins Harry O Neill: Beacon Environmental Services, Inc. Vapor intrusion field investigations, passive soil gas
Estimation of Generic Subslab Attenuation Factors for Vapor Intrusion Investigations Reviews two USEPA methods for estimation of default soil gas-to-indoor air attenuation factors. Two years preparing manuscript; Discussions with vapor intrusion experts across the mainland, including USEPA and various state agencies; Presentation at national conference prior to final paper; Informal review of draft manuscripts by regulators and private consultants; Eight months peer review by Groundwater Monitoring & Remediation; Published December 2014.
Vapor Intrusion Subslab Attenuation Factor Attenuation of intruding vapors in indoor air; Critical parameter for vapor intrusion screening; Two primary methods for estimation of default AFs. Vapor Attenuation (negative P) Subslab Soil Gas Attenuation Factor slab subslab vapors contaminated soil or groundwater
Method #1: Ratio of Vapor Entry to Indoor Air Exchange Indoor Air Exchange Rate (L/minute) Vapor Attenuation Subslab AF =Vapor Entry Rate IAER slab subslab vapors Vapor Entry Rate (L/minute) contaminated soil or groundwater
Subslab Soil Gas Attenuation Factors Method #1 Examples: California (DTSC 2011, rounded): 1Vapor Entry Rate (5 L/min) 2IAER (2,000 L/min) Subslab AF = VI Model Default AF: 1/400 (0.0025) Hawai i (HDOH 2012): 1Vapor Entry Rate (4 L/min) 2IAER (4,000 L/min) VI Model Default AF: 1/1,000 (0.001) Subslab AF = 1. Vapor entry rate per 100m2 2. Default house volume = 244 m3
Subslab Soil Gas Attenuation Factors Method #1: Divide estimated Vapor Entry Rate by estimated Indoor Air Exchange Rate Used as basis of 2004 USEPA vapor intrusion guidance; Well studied by building radon experts and ventilation engineers; Models based on field studies and empirical data; Used in site-specific USEPA and DTSC vapor intrusion models.
Method #2: Indoor Air and Subslab Soil Vapor Database Indoor Air Sample ( g/m3) Subslab AF =Conc. Indoor Air Conc. Soil Vapor X slab X Subslab Vapor Sample ( g/m3) contaminated soil or groundwater
SubSlab Soil Gas Attenuation Factors Method #2: Divide measured concentration in indoor air by measured concentration in subslab soil gas Intuitively more direct and accurate; USEPA database for hundreds of homes and buildings; Compiled in the early 2000s; Calculate generic AFs based on statistical evaluation of database; Draft document published 2012 (subsequent extensive public comment received).
Basis of USEPA VI Subslab Attenuation Factors Median = 0.003 (1/333) 95% UCL= 0.03 (1/33) Frequency 0.0001 0.001 0.01 0.1 1.0 Subslab Attenuation Factor Less Conservative More CalDTSC Default SSAF = 0.05 Conservative
Subslab Soil Gas Attenuation Factors Method #2: Draft default subslab AF = 0.03 (95% UCL) proposed; Currently favored by some USEPA regulators; Resulting subslab soil vapor (and groundwater) screening levels 20-30+ times lower than published by some states based on Method #1 approach; Significantly larger number of sites flagged for potentially vapor intrusion risks; Many left in bureaucratic or technical limbo (low priority, irresolvable source of VOCs in indoor air, etc.); Imposes a significant legal and financial burden on property owners and responsible parties; Default attenuation factors seem excessively conservative for much/most of US based on more detailed field data.
Additional Health Risk? TCE? Stress Headaches, High blood pressure, Heart problems, Diabetes, Dermatitis, Asthma, Arthritis, Depression, Anxiety.
Problem #1: One Size Does Not Fit All USEPA Database: Most data from cold areas of country; Application to Hawai i questionable; Majority of indoor air samples from basements, poor ventilation (dungeon); Indoor air data within potential background for 80% of buildings; Most data not useable to calculate AFs; Worst-case scenario assumes heating & high vapor flux year round (dragon); Use of combined minimum indoor air exchange rate and maximum vapor intrusion rate questionable (pica house); Rates positively correlated (IAER increases as vapor entry rate increases).
Still an understandable approach when starting out But CalEPA 2011 (among others): The default attenuation factors assume [that] the subsurface is reasonably homogeneous (uniform).
Second and Bigger Database Problem Subslab AF =Conc. Indoor Air Conc. Soil Vapor Reliance on SINGLE SUBSLAB SAMPLE to calculate a subslab AF for 85+% of individual structures included in database (max 3 samples for other structures?); 1,000s of potential one-liter, vapor samples under a single slab; Representativeness of sample collected questionable; Increasing number of samples typically reveals increasing spatial heterogeneity (e.g., high-density Vapor Pin and passive sampler data); Spatial variability due to source area heterogeneity, soil type, moisture, preferential pathways, air movement, etc.
Subsurface Vapor Plume Heterogeneity Subslab AF =Conc. Indoor Air Conc. Soil Vapor VOC concentrations in vapor plumes can vary by orders of magnitude; Calculated subslab AF depends on where sample taken; Vapor entry point(s) likewise usually unknown; Additional uncertainty due to temporal variability for both soil gas and indoor air; Potential error in estimated AF for a building not quantifiable. X X X X Example petroleum vapor plume under building (Luo 2009).
Implications for Database Median Accuracy of individual subslab AFs unknown; Error in extrapolated, generic attenuation factors not quantifiable; Database not technically defensible for development of generic attenuation factors; Can t be fixed by statistical analysis; Median AF similar to Method 1 but error unknown. Frequency 95% UCL IA:Random Subslab Noise? Recommended Reading (Silver 2012): The Signal and the Noise: Why So Many Predictions Fail - but Some Don't
Statisticians Cant Fix the Problem for You Imagine if Survey of ages and weight but unknown number of people lied; Field data but PID found to be malfunctioning and error unknown; Lab data but equipment malfunctioned and error unknown 1.8 0.71 0.94 2.4 1.5 0.18 0.15 0.18 0.32 0.047 0.32 0.37 0.60 1.9 0.24 0.09 0.05 0.11 0.054 0.036 0.061 0.33 15 15 6.3 16 14 0.24 0.16 0.73 0.46 630 63 480 62 210 7.4 9.4 3.5 16 16 3.6 1.7 4.6 3.6 3.6 32 26 5.5 160 19 2,300 310 420 2,000 8,400 26 59 12 24 37 14 18 16 12 22 27 15 40 39 52 87 110 93 210 96 9.9 4.8 18 42 200 16 1.9 40 16 47 5.2 8.2 7.5 1.5 1.8 37 45 50 41 34 980 600 1,100 6,100 370 36 26 33 29 36 7.7 6.0 91 14 4.9 0.14 0.18 0.2 0.26 0.34 1.2 0.43 1.0 8.1 Collecting more data of unknown reliability doesn t help; Start over
Back to Method #1: More Technically Defensible Indoor Air Exchange Rate (L/minute) Vapor Attenuation Subslab AF =Vapor Entry Rate IAER slab subslab vapors Vapor Entry Rate (L/minute) contaminated soil or groundwater
Method #1: New and Improved Song et al (2014): Quantifying the influence of stack and wind effects on vapor intrusion (HERA, Vol 20). Used well-established building leakage models to estimate daily change in indoor air pressure ( P), based on building design and climate data; Feed into USEPA vapor intrusion model, generate daily vapor entry rate; Model calculates daily subslab AFs. Building Leakage Model P slab Vapor Intrusion Model contaminated soil or groundwater
Daily, Seasonal & Annual Average Vapor Flux Rates Based on Building Leakage Models (after Song et al 2014) Higher Vapor Flux When Home Heated *Lower Vapor Flux When Home Cooled Entry Rate (L/min) Modeled Vapor 8 winter spring summer fall winter 6 4 2 0 1 30 60 90 120 150 180 210 240 270 300 330 360 Day of Year *Assumes open windows and home under negative pressure due to wind effects Vapor entry rate and IAER positively correlated and vary with climate/season (but not exactly linear); Maximum similar to USEPA default (5 L/minute per 100m2); Near zero vapor intrusion if no wind and open windows (no P); Air conditioning can over pressure building and force indoor air into subslab space ( vapor extrusion ).
Expanded Method #1 Assume Heating Day vs Cooling Day default Vapor Entry Rates: Heating Days (mean temp <65 F): 5 L/minute Cooling Days (mean temp >65 F): 2 L/minute Average Vapor Entry Rate AF (L/min) = (#<65 F Days x 5 L/min) + (#>65 F Days x 2 L/min) 365 Develop climate-specific, annual-average vapor entry rates per 100m2 bottom floor area based on number of days below and above mean temperature of 65 F (55 F for Mediterranean climates); Combine with published estimates of annual average indoor air exchange rates.
*Climate Zones and Daily Average Temperatures Region B2 (Coastal) Region A (cold, +Alaska) Region C (Med) Region B1 (warm) Region D (tropical) +Hawai i Region D (tropical) Published Climate Data overlain on *CBECS Climate Zone Map: Region A (cold): Average 303 days <65 F, 62 days >65 F Region B (warm/hot summers): Average 243 days <65 F, 122 days >65 F Region C (Mediterranean): Average 166 days <55 F, 199 days >55 F Region D (tropical): Average 0 days <65 F, 365 days >65 F *Modified from Commercial Buildings Energy Consumption Survey (ICC 2012)
Example Region-Specific Annual-Average Vapor Entry Rates (VER) 1Average Number of Heating Days per Year (VER = 5 L/min) 2Average Number of Cooling Days per Year (VER = 5 L/min) 4Weighted Annual Average Vapor Entry Rate Climate Zone Region A (Cold) 303 62 4.5 L/min Region B (Warm) 243 122 4.0 L/min 2Region C (Med) 166 199 3.4 L/min Region D (Tropical) 0 365 2.0 L/min 1. Heating (Non-Cooling) Day = Mean daily temperature <65 F. 2. Mediterranean Heating Day = Mean daily temperature <55 F. 3. Cooling Day = Mean daily temperature Heating Day temperature. 4. Vapor flux per 100m2 lower floor space area.
Published Regional Indoor Air Exchange Rates (residential homes) 1,2Example Default Indoor Air Exchange Rate Climate Zone Region A (Cold) 0.35/hour 1,423 L/min Region B (Warm) 0.50/hour 2,033 L/min Region C (Med) 1.0/hour 4,067 L/min Region D (Tropical) 1.0/hour 4,067 L/min 1. Based on review of published information for residential homes each climate region. 2. Default 100m2 floor area and 244m3 total volume (USEPA 2004).
Example Estimation of Region Specific, Annual Average Subslab Attenuation Factors AF =Ave Vapor Entry Rate Ave IAER Default Annual Average Vapor Entry Rate 4.5 L/min Subslab Attenuation Factor 0.003 Indoor Air Exchange Rate 1,423 L/min Climate Zone 1Region A (Cold) 4.0 L/min 2,033 L/min 0.002 Region B (Warm) 3.4 L/min 4,067 L/min 0.0008 Region C (Med) 2.0 L/min 4,067 L/min 0.0005 Region D (Tropical) 1. Database method got the subslab AF right much of the time (median = 0.003)? Tells us something about vapor plume variability.
Example Vapor Intrusion Risk Regions VIR Region A(cold, +Alaska) Highest Risk VIR Region B1 (Coastal) Moderate Risk VIR Region C (Med) Lower Risk VIR Region B2 (warm) Moderate Risk VIR Region D (tropical) +Hawai i VIR Region D (tropical) Lowest Risk Region A: High Vapor Flux, Low Indoor Air Exchange (SSAF = 0.003) Region B: Mod Vapor Flux, Mod Indoor Air Exchange (SSAF = 0.002) Region C: Lower Vapor Flux, High Indoor Air Exchange (SSAF = 0.0008) Region D: Low Vapor Flux, High Indoor Air Exchange (SSAF = 0.0005)
Summary USEPA vapor intrusion database worthwhile to compile but not technically defensible due to growing evidence of vapor plume heterogeneity; Comparison of estimated vapor flux rate to IAER most defensible method for estimation of subslab AFs; Vapor Intrusion Risk regions can be designated using a combination of: Estimated vapor entry rates based on building leakage models, vapor flux models and climate data; Published indoor air exchange rate data; Calculation of annual-average subslab attenuation factors; More accurate identification of high-risk vapor intrusion sites; More expedited clearance of low-risk vapor intrusion sites based on groundwater and soil gas data; Use soil gas data from center of slab, slab area closest to source and downwind slab area for worst-case screening.
Current HDOH Vapor Intrusion Action Levels (e.g., TCE residential chronic exposure) Average Vapor Entry Rate: 4L/minute (too high); Average IAER (1/hr): 4,000 L/minute; Subslab Soil Gas AF: 0.001 (1/1,000). TCE Indoor Air 1.2 g/m3 TCE in soil gas >3m (10ft) from the water table not expected to exceed 1,200 g/m3 if TCE in groundwater <610 g/L. slab SS Soil Gas:1,200 g/m3 >3m (10ft) Groundwater: 610 g/L Based on combined models and field observations
HDOH Vapor Intrusion Guidance Vapor intrusion action levels overly conservative by at least 2X (assumed vapor flux rate too high); Subslab soil gas ALs adequately conservative (assumed vapor flux rate too high); Groundwater vapor intrusion action levels adequately protective (no exceedences of shallow soil gas action levels reported); Collect soil gas samples if VOC-contaminated soil suspected or known; Unexpectedly high, shallow soil gas VOCs related to previously unidentified soil source, inadequate groundwater data, etc.; A/C probably negates significant vapor intrusion risk for most buildings (over-pressured buildings could force indoor air into subslab space); Refer to expanded vapor intrusion discussion in Section 13 of HDOH TGM; No updates currently planned.
Other Vapor Intrusion Guidance Approach presented in paper under consideration in several states; Reviewing data for paired, groundwater and shallow soil gas data to confirm adequacy of groundwater vapor intrusion screening levels in different areas.
Nest Step: Bigger and/or More Soil Vapor Samples (sound familiar?) It s a bird! Are discrete soil gas samples too small to be reliable?
Smaller is NOT Better Subslab Vapor Sample Volume vs Approximate Area of Influence 100L For example only Example subslab areas covered by different volumes of subslab soil gas samples (assuming sample collected from first 15cm of fill under slab and 20% air-filled porosity); Total volume of air-filled pore space in first 15cm of subslab fill approximately 2,250 liters per 100m2 area; Collection of large-volume samples more challenging in tight soils (increase # of samples).
Designate Subslab Vapor Sample Decision Units For example only Objective: Estimate Mean VOC concentration in subslab soil vapors for designated Decision Units (e.g., refer to HDOH and ITRC guidance on Incremental Sampling); Develop sampling method to achieve this goal (i.e., larger and/or more soil vapor samples)
Next HEER Webinar When: March 11th, 2015 (11am-12pm HI Time) Who: Martin Schmidt (Cox-Colvin, Inc.) and Harry O Neil (Beacon Environmental, Inc.) What: Use of Active and Passive Soil Gas Samples to Support Vapor Intrusion Investigations PCE TCE