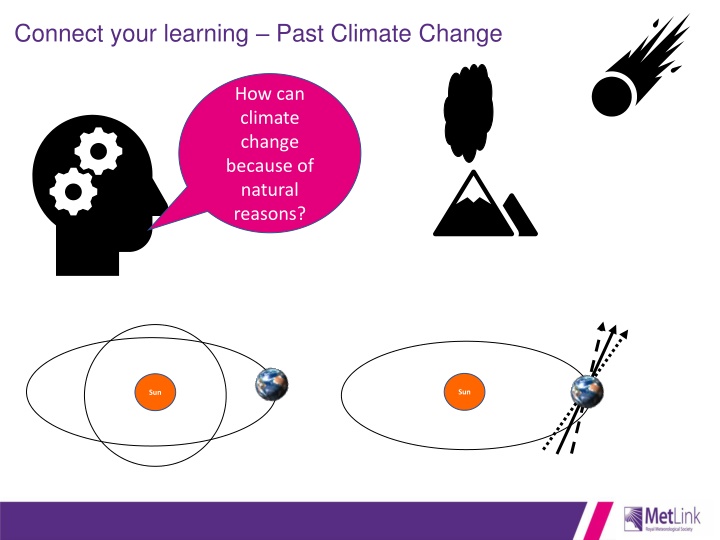
Connect your learning – Past Climate Change
Explore the causes and impacts of climate change, including natural factors like the sun and human factors like fossil fuel use. Learn about the relationship between CO2 and temperature, global warming, and future climate scenarios.
Download Presentation
Please find below an Image/Link to download the presentation.
The content on the website is provided AS IS for your information and personal use only. It may not be sold, licensed, or shared on other websites without obtaining consent from the author. Download presentation by click this link. If you encounter any issues during the download, it is possible that the publisher has removed the file from their server.

Presentation Transcript
Connect your learning Past Climate Change How can climate change because of natural reasons? Sun Sun
CHANGING CLIMATES Objectives 1.To be able to DESCRIBE the major changes to temperature and CO2over short and longer periods of time. 2.To be able to explain global warming and HUMAN reasons why climate changes. 3.To EVALUATE what might happen to CO2levels and temperature in the future. Outcomes 1. A paragraph describing the link between CO2and temperature since 1850. 2. Video notes and a diagram showing how global warming works and why climate changes because of HUMAN activity. 3. The ability to discuss verbally what might happen with extra global warming in the future.
Human and Natural climate change In Lesson 6 we looked at how the make up (composition) of our atmosphere and volcanoes, the way our planet orbits around the Sun and the position of the continents (continental drift) all can cause climate to change. These are natural reasons for climate change In this lesson, we explore the impacts humans can have on the climate system, through our use of fossil fuels and changing land use. These are the HUMAN reasons for climate change
How is climate changing Globally?
Long term climate change Temperature and CO2 concentration in the atmosphere over the last 400 000 years (from the Vostok ice core) X 1. Describe the relationship between CO2and Temperature The graph shows that in general the pattern between CO2and temperature is that 410 November 2019 360 CO2Concentration (ppmv) 310 260 A good example of this is at years where the CO2 is ppmv and the temperature is different from today 210 C 160 400 000 350 000 300 000 250 000 200 000 150 000 100 000 50 000 0 Years before present (when present is taken as 1950) 4 Warmer than present ppmv = parts per million volume: this is a measure of what proportion of the air is carbon dioxide Temperature change from present ( C) 2 0 Present Temperature (1950) -2 Colder than present -4 -6 -8 -10 400 000 350 000 300 000 250 000 200 000 150 000 100 000 50 000 0 Years before present (when present is taken as 1950) Graph sketched from J.R.Petit, J.Jouzel, et al. Climate and atmospheric history of the past 420 000 years from the Vostok Ice Core in Antarctica, Nature 399 pp429-436, 1999
Long term climate change Temperature and CO2 concentration in the atmosphere over the last 400 000 years (from the Vostok ice core) X 410 November 2019 2. Has the Earth been generally warmer or colder than present? 3. How many glacial periods are indicated on the graph? 4. Look at the 2019 CO2 level, what could this mean for temperatures going forward? Warmer than present Present Temperature (1950) 360 CO2Concentration (ppmv) 310 260 210 160 400 000 350 000 300 000 250 000 200 000 150 000 100 000 50 000 0 Years before present (when present is taken as 1950) 4 Temperature change from present ( C) 2 0 -2 Colder than present -4 -6 -8 -10 400 000 350 000 300 000 250 000 200 000 150 000 100 000 50 000 0 Years before present (when present is taken as 1950) Graph sketched from J.R.Petit, J.Jouzel, et al. Climate and atmospheric history of the past 420 000 years from the Vostok Ice Core in Antarctica, Nature 399 pp429-436, 1999
The change in CO2and Temperature since 1850 Past GLOBAL climate change RECENT HISTORY 420 0.8 Concentration of CO2(Parts per million) 0.7 400 0.6 Temperature Change C 0.5 380 0.4 Describe the patterns on this GLOBAL graph. 360 0.3 0.2 340 1. What happens to the temperature over time? What are the start and end values for temperature? 0.1 320 Average Temperature between 1850 and 1900 0 -0.1 300 -0.2 280 -0.3 1910 1960 2020 1850 1860 1870 1880 1890 1900 1920 1930 1940 1950 1970 1980 1990 2000 2010 2. What happens to the CO2over time? What are the start and end values for CO2? Year Good words to use Fluctuating, rising, any figures and dates, Highest, lowest, Long term mean (average)
Why does climate change? The HUMAN causes
The Greenhouse Effect Using the video: 1. What drives the Earth s climate system? 2. What happens to the Sun s energy when it reaches our atmosphere? 3. What happens to the Earth s heat? 4. Without the Greenhouse gases would we be able to live on Earth? Draw a copy of the diagram on the next slide https://youtu.be/lrPS2HiYVp8
How the Greenhouse Effect works 2. Some of this energy is reflected directly back out to space from dust, ice and clouds 6.Some heat energy escapes to space 1. The Sun sends its energy to Earth as INSOLATION CO2, H2O, CH4 5. This heat energy is trapped by carbon dioxide, methane and water vapour 7. Human activity adds extra gasses causing EXTRA ANTHROPOGENIC warming 4. Heat rises through the Earth s atmosphere The atmosphere The Earth 3. Light energy is converted to heat energy at the Earth s surface
1. What has happened over the course of the last century? 2. What has been the average global temperature? 3. What does the evidence point to? 4. What natural events can cause warming of our planet? 5. What does most evidence suggest about the recent warming we have seen on planet Earth? 6. Which activities increase the concentrations of greenhouse gases in the atmosphere? 7. What sources of CO2 are there? 8. What sinks of CO2are there? The causes of climate change https://youtu.be/uHbxSYDqTR8
Changing Climate- Review 1.DESCRIBE the major changes to temperature and CO2over short and longer periods of time 2.Explain global warming and reasons why climate changes In pairs verbally explain both of the key learning points from today s lesson. OR https://quizlet.com/_8y58ao?x=1jqt&i=38anvz
Width of shape around the line indicated the degree of variability of the estimates Global warming scenarios 180 2030 - Deadline date for action 160 No climate action policies 4.1 to 4.8 C warmer Unprecedented heat waves Global greenhouse gas emissions (Gigatonnes of CO2 equivalent) 140 120 Increasingly severe impacts 100 80 Paris Climate conference 2015 Kyoto Climate conference 1997 Current climate action policies 3.1 to 3.7 C warmer 20-30% increase in extreme rainfall 60 Risk of global mass extinctions 40 Promised (pledged) policies 2.6 to 3.2 C warmer Historical Carbon Emissions Global crop decline 20 Major Amazon die back 2 C warmer than today Upper end of Paris Agreement in 2015 Millions at risk of losing homes due to sea level rise 0 Major risk to most coral reefs 1990 2000 2010 2020 2030 2040 2050 2060 2070 2080 2090 2100 1.5 C warmer than today Goal of Paris Agreement in 2015 Food production losses -20 Extreme heat waves with severe social impacts Homework all tasks on the sheet
Thunk Question Is the sunlight ever yours? Thunk question A Thunk question is a simple-looking question about everyday things that stops you in your tracks and helps you start to look at the world in a whole new light. https://www.indep endentthinking.co. uk/thunks/ n.b. Thunk in this sense is not an official word in the Cambridge English Dictionary!
Climate change reflection 1850 1900 2018 2000 1950 England Compare these climate stripes for England, Egypt and Greenland Egypt Greenland Climate stripes are data graphics that use a series of coloured stripes chronologically ordered to show long-term temperature trends. Blue stripes indicate cooler years and red stripes warmer compared to the 1971-2000 period