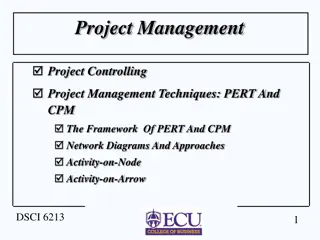
Precedence Diagramming and Activity Relationships in Engineering Management
Precedence diagramming in project management involves setting up relationships among activities, such as Finish-to-Start, Start-to-Start, Finish-to-Finish, and Start-to-Finish. Understanding these relationships helps in creating efficient project schedules. Lag time, the delay between activities, is also discussed, highlighting its limitations. The lecture aims to explain how to draw Precedence network diagrams and calculate Early/Late Start/Finish Times in project schedules.

Download Presentation

Please find below an Image/Link to download the presentation.
The content on the website is provided AS IS for your information and personal use only. It may not be sold, licensed, or shared on other websites without obtaining consent from the author. Download presentation by click this link. If you encounter any issues during the download, it is possible that the publisher has removed the file from their server.
E N D
Presentation Transcript
ENGINEERING MANAGEMENT (GE 404) 1 LECTURE # LECTURE #5 5 Scheduling Networks Precedence Diagramming September 24, 2024 GE 404 (Engineering Management)
Objectives of the Present lecture 2 To explain how to draw Precedence network diagrams To discuss how to calculate Early/Late Start/Finish Times in Precedence Network diagrams September 24, 2024 GE 404 (Engineering Management)
Precedence Diagramming 3 Precedence diagramming is an extension to the original Activity-On-Node concept. Precedence diagramming includes precedence relationships among the activities. In addition, one may specify a lagtime associated with any of the precedence relationships. A successor "lags" a predecessor, but a predecessor "leads" a successor. Lag time can be designated on a dependency line with a positive, negative, or zero value. The prime relationship used in PERT/CPM network is Finish-to-start type of dependency, with FSij = 0 . September 24, 2024 GE 404 (Engineering Management)
Activity Relationships 4 Finish-to-Start (FS) In a finish-to-start relationship, the start of an activity depends on the completion of its preceding activity. Example: Footing excavation must be completed prior to placing concrete for the footing Start-to-Start (SS) In a start-to-start relationship, an activity can not start before its preceding activity starts Example: Project management activities can not start before the Project work starts Finish-to-Finish (FF) In a finish-to-finish relationship, the two activities are related by the fact that they must be completed at the same time Example: In a simple task of setting a flagpole, the backfilling task and the positioning the pole task will be finished at the same time. Start-to-Finish (SF) In start-to-finish relationship, the finish of an activity depends on the start of its preceding activity (A rare relationship) Example: In a Hospital emergency, the previous shift can not finish before the new shift starts Say you re building a new gas pipeline. You would first finish construction and implementation of the new pipeline before you would begin shutting down and breaking down the old pipeline. September 24, 2024 GE 404 (Engineering Management)
Lag 5 The amount of time that exists between the early finish of an activity and the early start of a specified succeeding activity Calculate lags for each link by determining the difference between the ES of each activity following a link line and the EF of the activity that precedes it Limitations and Disadvantages of Lag: Lag would complicate the scheduling process Lags are not extensively used except where the time effects are substantial for special project type September 24, 2024 GE 404 (Engineering Management)
Finish-to-Start Activity Precedence Relationships with Lag Values 6 FSij FSjk Activity j Activity k Activity i = = Note lag : and lag FS FS ij ij jk jk = + ES EF FS = LS LF D j i ij i i i = + = EF ES D LF LS FS j j j i j ij September 24, 2024 GE 404 (Engineering Management)
Start-to-Start Activity Precedence Relationships with Lag Values 7 Activity i Activity j SSij = = Note lag : and lag SS SS ij ij jk jk Activity k SSjk = + = ES ES SS LS LS SS j i ij i j ij = + = + = + EF ES D LF LS D LS SS D j j j i i i j ij i September 24, 2024 GE 404 (Engineering Management)
Finish-to-Finish Activity Precedence Relationships with Lag Values 8 FFij Activity i FFjk Activity j = = Note lag : and lag FF FF ij ij jk jk = + EF EF FF j i ij Activity k = + = ES EF FF D EF D j i ij j j j = = LS LF FF D LF D i j ij i i i = LF LF FF i j ij September 24, 2024 GE 404 (Engineering Management)
Start-to-Finish Activity Precedence Relationships with Lag Values 9 Activity i = = Note lag : and lag SF SF ij ij jk jk SFij Activity j SFjk Activity k = LS LF SF = + EF ES SF i j ij j i ij = + = + LF LF SF D LS D = + = S ES ES F D EF D i j ij i i i j i ij j j j September 24, 2024 GE 404 (Engineering Management)
Note on SFij 10 Activity j cannot finish till i starts (rare) SFij is equal to the minimum number of time units that must transpire from the start of the predecessor i to the completion of the successor j. Example For the shown diagram calculate total lag if = ij SF SF = ' ' ' ij and 4 6 SFij' i j SFij'' = + = + = ' ' ' ij 4 6 10 SF SF SF ij ij The finish of j must lag 10 units after the start of i September 24, 2024 GE 404 (Engineering Management)
Summary 11 Finish-to-Start Relationships with Lag Values FSij : FS EF ES + = = LF LS FS i j ij j i ij Start-to-Start Relationships with Lag Values SSij : ES ES + = = + LF LS SS D SS i j ij i j i ij Finish-to-Finish Relationships with Lag Values FFij : FF EF ES + = = LF LF FF D i j ij j i ij j Start-to-Finish Relationships with Lag Values SFij : F ES ES + = S = + D LF LF SF D i j ij i j i ij j September 24, 2024 GE 404 (Engineering Management)
Generalized Equations 12 FORWARD PASS COMPUTATIONS BACKWARD PASS COMPUTATIONS Terminal Time Initial Time LS FS + EF FS j ij i ij SS = LF FF Min(all ) LF + = ES SS j ij Max(all ) ES i j i ij j i + LS D + EF FF D j ij i i ij j + LF SF D + j ij i ES SF D i ij j = + = LS LF D EF ES D i i i j j j September 24, 2024 GE 404 (Engineering Management)
Composite Start-to-Start and Finish-to-Finish (ZZij)Activity Precedence Relationships with Lag Values 13 ZZij is a combination of two constraints, i.e., a start-to-start and finish-to-finish relationship. It is written with the SSij time units first, followed by the FFij time units. Example: ZZij =5, 6 The start of activity j must lag 5 units after the start of activity i & The finish of activity j must lag 6 units after the finish of activity i September 24, 2024 GE 404 (Engineering Management)
Representation 14 SS ij FF ij FS ij ES Duration EF ES Duration EF SF ij ZZ SS FF Activity (j) ( ) ij ij ij Activity (i) Constraints with lag/lead Durations LS Total Float LF LS Total Float LF September 24, 2024 GE 404 (Engineering Management)
Free and Total Floats in Overlapping Networks 15 Free Float of an activity can be defined as time span in which the completion of the controlling date of an activity may occur and not delay the termination of the project nor delay the early status of the following activity. ES EF FS j i ij ES ES SS j i ij = Min(all ) FF i j EF EF FF j i ij EF ES SF j i ij Total float (TF) equation is same as it was developed for the single relationship network. September 24, 2024 GE 404 (Engineering Management)
Problem-1 16 For the given precedence diagram, complete the forward and backward pass calculations. Assume the project starts at T=0, and no splitting on activities is allowed. Also assume that the project latest allowable completion time (project duration) is scheduled for 30 working days. F D SF 12 Document program (D=12) Test & debug program (D=6) A B FS 0 Develop system spec. (D=8) SS 3 FF 4 Write comp. program (D=12) SS 6 C E Collect system data (D=4) Run program (D=6) FS 0 ES D EF Activity ID LS TF LF September 24, 2024 GE 404 (Engineering Management)
Solution ES D EF Activity ID Step-1: Network diagram LS TF LF 17 12 6 D F 12 8 0 B A END 4 6 C E September 24, 2024 GE 404 (Engineering Management)
Step-2: Forward Pass Computations 18 Initial Time + EF FS i ij + = ES + SS ] 1 [ ( ) ES Max all i ij j i EF FF D i ij j + ES SF D i ij j = + ] 2 [ EF ES D j j j = = Initial Time 0 ES Activity A A = + = + = 0 8 8 EF ES D A A A = Initial + A FF Time = AB D 0 A = + = ( ) 0 3 3 ES Max ES SS Activity B B + = + = 8 4 12 0 EF A AB B = + = + = 3 12 15 EF ES D B B B = Initial + SS B Time 0 B = ( ) ES Max Activity C = + = 3 6 9 ES C D BC = + = + = 9 4 13 EF ES C C C September 24, 2024 GE 404 (Engineering Management)
Initial Time + EF FS i ij + = ES + SS ] 1 [ ( ) ES Max all i ij j i EF FF D i ij j + ES SF D i ij j = + ] 2 [ EF ES D j j j = 0 Initial Ti me = ES Max(B) + = + = 15 0 15 EF FS D D Activity D B BD = + = + = 15 6 21 EF ES D D D = Initial DE Time = 0 + + = 21 0 21 EF FS = D ( , ) ES Max C D E + = + = , 13 0 13 OR EF FS Activity E C CE = + = + = 21 6 27 EF ES D E E E = Initial DF FS Time = F 0 D + + = 15 12 = 12 15 ES SF D = ( ) ES Max D F Activity F + = + , 13 0 13 OR EF C CF = + = + = 15 12 27 EF ES D F F F 19 September 24, 2024 GE 404 (Engineering Management)
Contd. 20 15 21 15 27 12 6 SF 12 D F 12 0 8 8 3 15 27 27 0 FS 0 SS 3 FF 4 B A END SS 6 13 21 27 4 6 9 C E FS 0 September 24, 2024 GE 404 (Engineering Management)
Step-3 Backward Pass Computations Terminal Time = = Terminal Time 30 LF LS FS F j ij Activity F = LF FF ] 3 [ ( ) LF Min all = = = 30 12 18 LS LF D j ij i j F F F + LS SS D j ij i + LF SF D = = Terminal E LF Time = E D 30 = LF j ij i Activity E E = ] 4 [ LS LF D i i i = 30 6 24 LS E = Terminal E FS LS Time = 30 = 24 0 24 DE = ( ) Activity D LF Min , D E F or + = + = 30 12 6 24 LF SF D F DF D = = = 24 6 18 LS LF D D D D 15 21 15 27 12 6 SF 12 D 3 F 3 12 0 18 24 18 30 8 8 3 15 27 27 0 FS 0 SS 3 FF 4 B A END 30 SS 6 13 21 27 4 6 9 3 30 C E 3 FS 0 24 30 21 September 24, 2024 GE 404 (Engineering Management)
Terminal Time = Terminal E FS LS Time = 30 = LS FS 24 0 24 j ij CE = ( , ) LF Min E F = Activity C LF FF ] 3 [ ( ) LF Min all or LS C j ij i j + LS SS D = = 18 0 18 FS j ij i F CF + LF SF D = = = 18 4 14 LS LF D j ij i C C C = ] 4 [ LS LF D i i i = Terminal FS D Time = BD 30 = 18 0 18 LS = ( ) LF Min , B C D OR Activity B + = + = 14 6 12 20 LS SS D C BC B = = = 18 12 6 LS LF D B B B = Terminal SS Time = D 30 = = Activity A ( ) 18 = 4 14 + LF Min LF FF A B B AB + = 6 3 8 11 LS B AB A = = = 11 8 3 LS LF D A A A 15 21 15 27 12 6 SF 12 D 3 F 3 12 0 18 24 18 30 8 8 3 15 27 27 0 FS 0 SS 3 FF 4 B A END 30 SS 6 13 21 27 4 6 9 3 3 11 6 3 18 3 30 C E 3 FS 0 14 5 18 24 30 22 September 24, 2024 GE 404 (Engineering Management)
Step 4: Slack time (Float time) 23 Earliest Earliest Latest Start Finish Activity ES A 0 B 3 C 9 D 15 E 21 F 15 Latest Finish LF 11 3 Yes 18 3 18 5 21 3 30 3 30 3 On Start LS 3 6 14 15 24 18 Slack LS ES Critical Path EF 8 15 13 21 27 27 Yes No Yes Yes Yes Critical path is the path with the least total float = The longest path through the network. CP1: A-B-D-E, CP2: A-B-D-F ; Critical Activities: A, B, D, E, and F September 24, 2024 GE 404 (Engineering Management)
Problem-2 24 Given the precedence network for a small engineering project with activity durations in working days, it is required to compute the activity times (ES, EF, LS, and LF) and total floats (TF) and then indicate the critical activities. 3 C 8 F 5 I FF 5 FS 3 SS 8 5 A 10 D 6 J 10 L FS 2 FF 5 ZZ 3,2 SF 3,4 FS 4 4 E 13 H 7 K SS 5 FS 0 September 24, 2024 GE 404 (Engineering Management)
Solution Step-1: Calculate ES and EF 25 8 11 16 19 24 3 C 8 8 F 5 I FF 5 FS 3 SS 8 0 5 7 17 13 19 24 34 5 A 10 D 6 J 10 L FS 2 FF 5 ZZ 3,2 SF 3,4 FS 4 5 9 9 22 9 16 4 E 13 H 7 K SS 5 FS 0 September 24, 2024 GE 404 (Engineering Management)
Step-2: Calculate LS and LF 26 8 3 C 11 8 8 F 16 19 5 I 24 FF 5 FS 3 8 11 8 16 19 24 SS 8 0 5 A 5 7 10 D 17 13 6 J 19 24 10 L 34 FS 2 FF 5 ZZ 3,2 0 5 17 27 23 29 24 34 SF 3,4 FS 4 5 4 E 9 9 13 H 22 9 7 K 16 SS 5 FS 0 9 13 13 26 13 20 September 24, 2024 GE 404 (Engineering Management)
Step-3: Calculate Total float 27 8 3 C 11 8 8 F 16 19 5 I 24 FF 5 FS 3 0 0 0 8 11 8 16 19 24 SS 8 0 5 A 5 7 10 D 17 13 6 J 19 24 10 L 34 FS 2 FF 5 ZZ 3,2 0 0 5 17 27 23 29 24 34 0 10 10 SF 3,4 FS 4 5 4 E 9 9 13 H 22 9 7 K 16 SS 5 FS 0 9 13 13 26 13 20 4 4 4 September 24, 2024 GE 404 (Engineering Management)
Step 4: Indicate critical activities 28 8 3 C 11 8 8 F 16 19 5 I 24 FF 5 FS 3 8 11 8 16 19 24 0 0 0 SS 8 0 5 A 5 7 10 D 17 13 6 J 19 24 10 L 34 FS 2 FF 5 ZZ 3,2 0 5 17 10 27 23 10 29 24 34 0 0 SF 3,4 22 FS 4 SS 5 5 4 E 9 9 13 H 9 7 K 16 FS 0 9 4 13 13 4 26 13 0 20 September 24, 2024 GE 404 (Engineering Management)
Problem-3 29 Given below the precedence network for a small engineering project with activity durations in working days. Compute the activity times (ES, EF, LS, and LF), total floats (TF) and free floats. Also indicate the critical activities and find the critical path. LEGENDS ES D Act LS TF EF FF LF 3 B SF,2 2 D 3 F SS, 2 5 A FF,1 6 C 6 E FS,1 September 24, 2024 GE 404 (Engineering Management)
Solution Initial Time + EF FS i ij + = ES + SS ] 1 [ ( ) ES Max all Step-1: ES and EF Calculations i ij j i EF FF D i ij j + ES SF D i ij j = 0 = + + ] 2 [ EF ES D j j j 30 = + = 5 5 EF ES D = 0 = Initial + A Initial time ES ES A A A A = Time = AB Initial FF 0 = + 2 = + = 3 5 EF ES D = = Max( ) 2 ES A B B B B + = 0 2 2 SS 0 = Time D = + 0 = + = 6 6 EF ES D = = Max( ) 0 ES A C C C C + = + = 5 1 6 0 EF A AB C = Initial SF Time D 0 = + 2 = + = 2 4 EF ES D = = Max( ) 2 ES B D D D D + = + = 2 2 2 2 ES B BD D = Initial + C EF Time FS 0 = + 7 = + = 6 13 EF ES D = = Max( ) 7 ES C E E E E = + = 6 1 7 CE = Initial + FS Time = DF 0 = + 13 = + = + = 3 16 EF ES D 4 0 4 EF FS = = Max( , ) 13 ES D E F F F D F + = + = 13 0 13 EF E EF September 24, 2024 GE 404 (Engineering Management)
Terminal Time LS FS j ij = LF FF ] 3 [ ( ) LF Min all Step-2: LF and LS Calculations j ij i j + LS SS D j ij i + LF SF D j ij i = ] 4 [ LS LF D i i i 31 = 16 = = 3 13 = 16 = LS LF D Terminal time LF F F F F = Terminal F FS LS Time = 16 = = 13 = = 13 = = Min ( ) LF F 6 7 LS LF D E E E E 13 0 13 EF = Terminal E LS Terminal F LS Time = CE Time = DF FS 16 = = = 6 = = = 6 = 6 0 LS LF D Min ( ) LF E C C C C 7 1 6 FS 16 = = 13 = = - 2 11 LS LF D = 13 = Min ( ) LF F D D D D 13 0 13 = Terminal SF Time = B D 16 = 14 = = = 14 = - 3 11 LS LF D Min ( ) LF D B + + = B B B 13 2 3 14 LF D BD = Terminal SS Time = A 16 + + = 11 = 2 5 14 LS D = 5 = Min ( , ) LF B C B AB = 5 = = - 5 0 LS LF D A = A A A 6 1 5 LF FF C AC September 24, 2024 GE 404 (Engineering Management)
Contd. 32 2 3 B 9 5 SF,2 2 2 D 9 4 11 14 11 13 13 3 F 0 16 SS, 2 13 16 0 5 A 0 5 0 5 FF,1 0 6 C 0 6 7 6 E 0 13 FS,1 0 6 7 13 September 24, 2024 GE 404 (Engineering Management)
ES EF FS j i ij ES ES SS j i ij Step-3: FF Calculations = Min(all ) FF i j EF EF FF j i ij EF ES SF j i ij 33 = = 2 0 2 0 ES ES SS B A AB = 0 = Min ( , ) FF B C A = = 6 5 1 0 EF EF FF C A AC = 4 = = - 2 - 2 0 FF EF ES SF B D B BD = 7 = = - 1 - 6 0 FF ES EF FS C E C CE = 13 = = - 4 - 0 9 FF ES EF FS D F D DF = 13 = = - 13 - 0 0 FF ES EF FS E F E EF September 24, 2024 GE 404 (Engineering Management)
Final Answer 34 2 3 B 9 5 0 SF,2 2 2 D 9 4 9 11 14 11 13 13 3 F 0 16 0 16 SS, 2 13 0 5 A 0 5 0 5 0 FF,1 0 6 C 0 6 0 6 7 6 E 0 13 0 13 FS,1 0 7 Critical Activities: A; C; E; and F Critical Path: A-C-E-F September 24, 2024 GE 404 (Engineering Management)
Hammock Activity 35 An activity that extends from one activity to another, but which has no estimated duration of its own. It is time-consuming and requires resources, but its duration is controlled, not by its own nature, but by the two activities between which it spans. Example: activity A ends on day 3 and activity C begins on day 10 and there is a set of activities that are summarized as activity B (the hammock activity) that must be done between activity A and activity C. Activity B doesn t have a specific duration it has the duration of the time between day 3 and day 10. If activity A takes longer than expected and ends on day 4, then the duration of activity B is now the duration of time between day 4 and day 10. Its ES and LS times are determined by the activity where it begins and its EF and LF times are dictated by the activity at its conclusion. September 24, 2024 GE 404 (Engineering Management)
Milestones 36 Milestones are points in time that have been identified as being important intermediate reference accomplishment of the work points during the Milestone events can include dates imposed by the customer for the finishing of certain tasks as well as target dates set by the project manager for the completion of certain segments of the work. Distinctive geometric figure is preferred to represent a milestone (circles, ovals, or other shapes can be used). September 24, 2024 GE 404 (Engineering Management)
Shortening of Project Duration 37 Reducing scope (or quality) Adding resources Concurrency (perform tasks in parallel) Substitution of activities September 24, 2024 GE 404 (Engineering Management)
Further Reading 38 Read more about the scheduling network models from: 1. Moder J., Phillips, C., and Davis, E. Project Management with CPM, PERT, and Precedence Diagramming, 3rd Edition. 2. Jimmie W. Hinze. Construction Planning and Management, Fourth Edition, 2012, Pearson. September 24, 2024 GE 404 (Engineering Management)
Thank You 39 Questions Please September 24, 2024 GE 404 (Engineering Management)


Activity")


")