Understanding Oligopoly Market Structure
This content delves into oligopoly, a market structure characterized by high concentration ratios and strategic interactions among a few sellers. It explores market concentration ratios in various U.S. industries, strategic behavior in oligopoly, and the challenges of collusion. Through examples like a cell phone duopoly in Smalltown, it highlights how firms in oligopoly make production decisions and compares market outcomes with monopoly and perfect competition. Game theory, cartels, and market effects of output and price changes are also discussed.
Download Presentation

Please find below an Image/Link to download the presentation.
The content on the website is provided AS IS for your information and personal use only. It may not be sold, licensed, or shared on other websites without obtaining consent from the author. Download presentation by click this link. If you encounter any issues during the download, it is possible that the publisher has removed the file from their server.
E N D
Presentation Transcript
Measuring Market Concentration Concentration ratio: the percentage of the market s total output supplied by its four largest firms. The higher the concentration ratio, the less competition. This chapter focuses on oligopoly, a market structure with high concentration ratios. 2 OLIGOPOLY
Concentration Ratios in Selected U.S. Industries Industry Concentration ratio 100% 100% 99% 94% 93% 92% 92% 89% 88% 85% 82% 79% Video game consoles Tennis balls Credit cards Batteries Soft drinks Web search engines Breakfast cereal Cigarettes Greeting cards Beer Cell phone service Autos
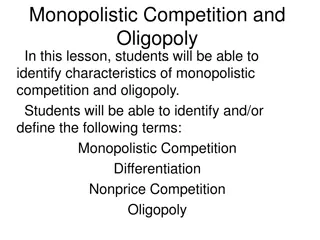
Oligopoly Oligopoly: a market structure in which only a few sellers offer similar or identical products. Strategic behavior in oligopoly: A firm s decisions about P or Q can affect other firms and cause them to react. The firm will consider these reactions when making decisions. Game theory: the study of how people behave in strategic situations. OLIGOPOLY 4
EXAMPLE: Cell Phone Duopoly in Smalltown P $0 5 10 15 20 25 30 35 40 45 Q 140 130 120 110 100 90 80 70 60 50 Smalltown has 140 residents The good : cell phone service with unlimited anytime minutes and free phone Smalltown s demand schedule Two firms: T-Mobile, Verizon (duopoly: an oligopoly with two firms) Each firm s costs: FC = $0, MC = $10 5
Collusion vs. Self-Interest Both firms would be better off if both stick to the cartel agreement. But each firm has incentive to renege on the agreement. Lesson: It is difficult for oligopoly firms to form cartels and honor their agreements. 6 OLIGOPOLY
A Comparison of Market Outcomes When firms in an oligopoly individually choose production to maximize profit, oligopoly Q is greater than monopoly Q but smaller than competitive Q. oligopoly P is greater than competitive P but less than monopoly P. 7 OLIGOPOLY
The Output & Price Effects Increasing output has two effects on a firm s profits: Output effect: If P > MC, selling more output raises profits. Price effect: Raising production increases market quantity, which reduces market price and reduces profit on all units sold. If output effect > price effect, the firm increases production. If price effect > output effect, the firm reduces production. 8 OLIGOPOLY
The Size of the Oligopoly As the number of firms in the market increases, the price effect becomes smaller the oligopoly looks more and more like a competitive market P approaches MC the market quantity approaches the socially efficient quantity Another benefit of international trade: Trade increases the number of firms competing, increases Q, brings P closer to marginal cost 9 OLIGOPOLY


