Delaware High School Survey: Youth Risk Behavior in New Castle County (2015)
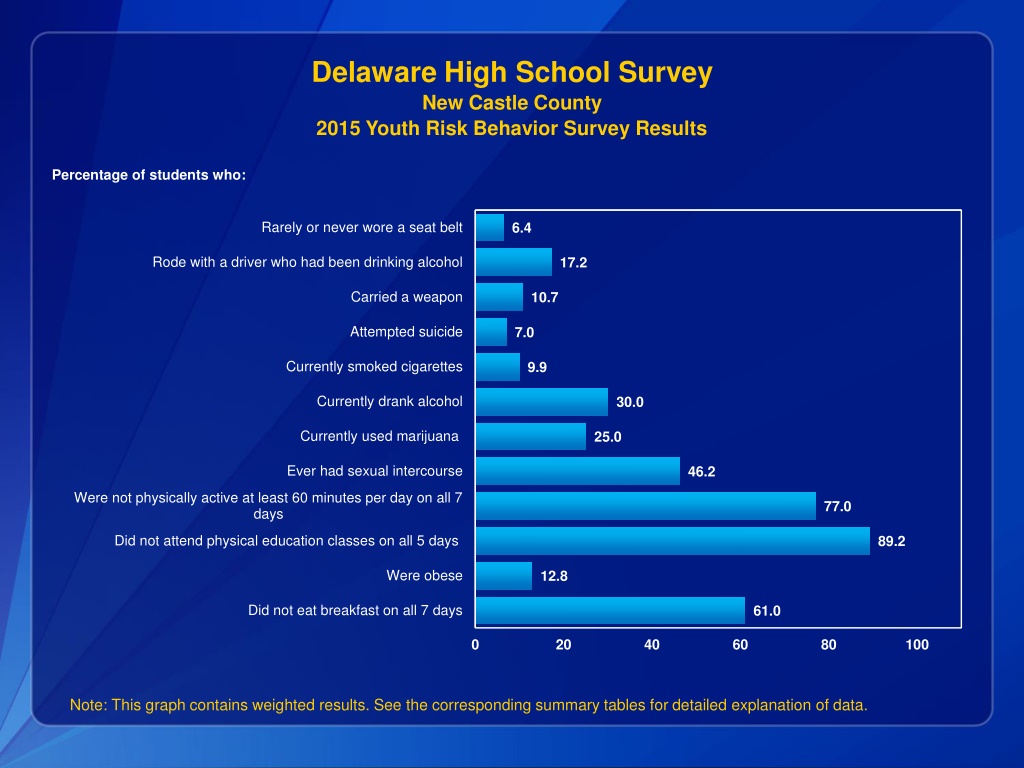
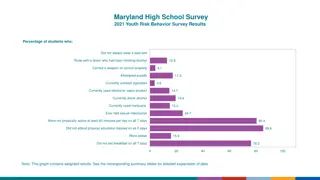
Results from the 2015 Youth Risk Behavior Survey in New Castle County, Delaware high schools highlight various behaviors among students. The data shows percentages and numbers of students who engaged in risky activities such as not wearing seat belts, riding with drivers under the influence of alcohol, carrying weapons, attempting suicide, smoking cigarettes, drinking alcohol, using marijuana, having sexual intercourse, being physically inactive, skipping physical education classes, being obese, and missing breakfast. The survey provides insight into the health and safety concerns of students in the region.

Download Presentation

Please find below an Image/Link to download the presentation.
The content on the website is provided AS IS for your information and personal use only. It may not be sold, licensed, or shared on other websites without obtaining consent from the author. Download presentation by click this link. If you encounter any issues during the download, it is possible that the publisher has removed the file from their server.
E N D
Presentation Transcript
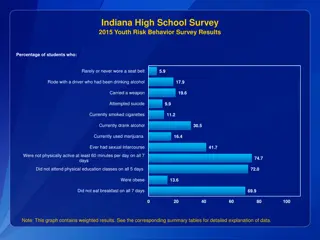
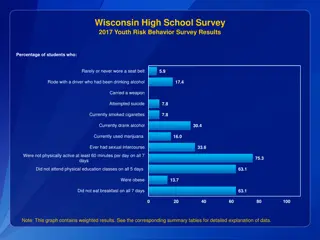
Delaware High School Survey New Castle County 2015 Youth Risk Behavior Survey Results Percentage of students who: Rarely or never wore a seat belt 6.4 Rode with a driver who had been drinking alcohol 17.2 Carried a weapon 10.7 Attempted suicide 7.0 Currently smoked cigarettes 9.9 Currently drank alcohol 30.0 Currently used marijuana 25.0 Ever had sexual intercourse 46.2 Were not physically active at least 60 minutes per day on all 7 days 77.0 Did not attend physical education classes on all 5 days 89.2 Were obese 12.8 Did not eat breakfast on all 7 days 61.0 0 20 40 60 80 100 Note: This graph contains weighted results. See the corresponding summary tables for detailed explanation of data.
Delaware High School Survey New Castle County 2015 Youth Risk Behavior Survey Results Percentage of students who: Sometimes, most of the time, or always wore a seat belt 93.6 Did not ride with a driver who had been drinking alcohol 82.8 Did not carry a weapon 89.3 Did not attempt suicide 93.0 Did not currently smoke cigarettes 90.1 Did not currently drink alcohol 70.0 Did not currently use marijuana 75.0 Never had sexual intercourse 53.8 Were physically active at least 60 minutes per day on all 7 days 23.0 Attended physical education classes on all 5 days 10.8 Were not obese 87.2 Ate breakfast on all 7 days 39.0 0 20 40 60 80 100 Note: This graph contains weighted results. See the corresponding summary tables for detailed explanation of data.
Delaware High School Survey New Castle County 2015 Youth Risk Behavior Survey Results Number of students in a class of 30 who: Rarely or never wore a seat belt 1.9 Rode with a driver who had been drinking alcohol 5.2 Carried a weapon 3.2 Attempted suicide 2.1 Currently smoked cigarettes 3.0 Currently drank alcohol 9.0 Currently used marijuana 7.5 Ever had sexual intercourse 13.9 Were not physically active at least 60 minutes per day on all 7 days 23.1 Did not attend physical education classes on all 5 days 26.8 Were obese 3.8 Did not eat breakfast on all 7 days 18.3 0 10 20 30 Note: This graph contains weighted results. See the corresponding summary tables for detailed explanation of data.
Delaware High School Survey New Castle County 2015 Youth Risk Behavior Survey Results Number of students in a class of 30 who: Sometimes, most of the time, or always wore a seat belt 28.1 Did not ride with a driver who had been drinking alcohol 24.8 Did not carry a weapon 26.8 Did not attempt suicide 27.9 Did not currently smoke cigarettes 27.0 Did not currently drink alcohol 21.0 Did not currently use marijuana 22.5 Never had sexual intercourse 16.1 Were physically active at least 60 minutes per day on all 7 days 6.9 Attended physical education classes on all 5 days 3.2 Were not obese 26.2 Ate breakfast on all 7 days 11.7 0 10 20 30 Note: This graph contains weighted results. See the corresponding summary tables for detailed explanation of data.