When study design and inference collide
Exploring the complexities of a study suggesting a reduced risk of COVID-19 in smokers, this content delves into the potential impact of measurement errors, unmeasured variables, and biases. It prompts critical discussion on the reliability of findings and the need for cautious interpretation of results in public health research.
Download Presentation
Please find below an Image/Link to download the presentation.
The content on the website is provided AS IS for your information and personal use only. It may not be sold, licensed, or shared on other websites without obtaining consent from the author. Download presentation by click this link. If you encounter any issues during the download, it is possible that the publisher has removed the file from their server.

Presentation Transcript
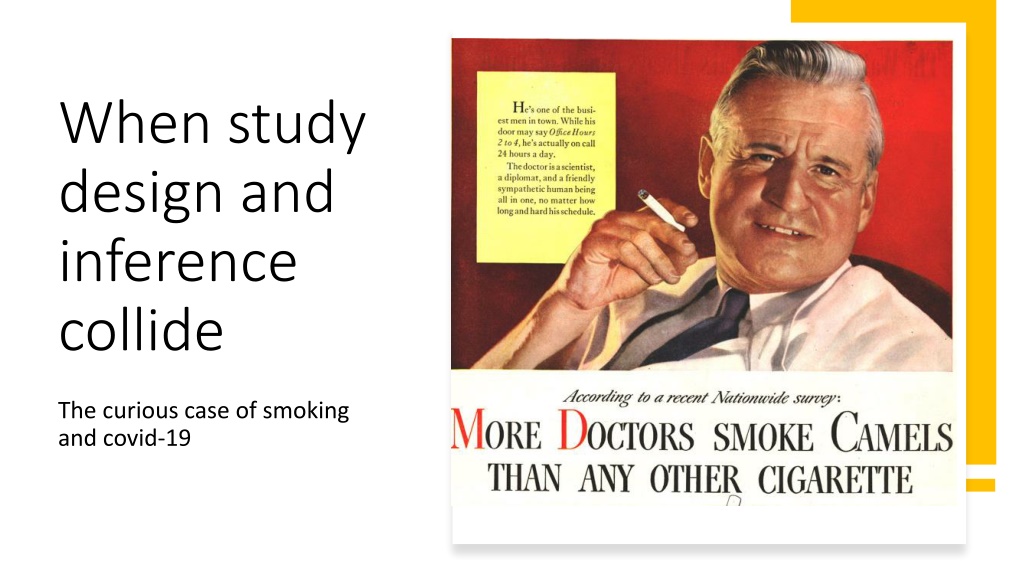
When study design and inference collide The curious case of smoking and covid-19
This study found a markedly decreased risk of both COVID-19 disease and ICU admission in smokers .
OK, weird things can happen in research. This was just one study ?
A review of 33 studies judged of at least fair quality found Current compared with never smokers were at reduced risk of SARS-CoV-2 infection [relative risk (RR) = 0.74, 95% credible interval (CrI) = 0.58 0.93].
A covid symptom tracker app was distributed widely (App Store, Google Play Store) to the general public. Consider this hypothetical research study Users were asked to log their symptoms daily and to record the outcome of any covid tests they had taken. The results showed a lower likelihood of a positive covid test in current smokers vs ex- and never-smokers. The researchers could not rule out that smoking may be protective of covid infection.
Your task Divide yourselves into groups of 4 5 people each. In your groups, critically discuss the study design just shown: 1. What might be the effect of measurement error? 2. What might be the effect of important but unmeasured variables? 3. What other sources of bias might there be? 4. How could such factors account for the specific finding of apparent protective effect of smoking on covid infection? Go to menti.com. Use code 8442 8993. Tell us your suggestions for 1-4.
Summary of your task The study design A covid symptom tracker is distributed to the general public. Users log their covid symptoms and tests. Results: Probability of a positive covid test lower in current smokers. Consider the likely effects of: Measurement error Unmeasured variables Other biases Could these design issues explain the results? (if the result is in fact a type I error) Go to menti.com. Use code 8442 8993
What is a collider? Source: Tattan-Birch, H. et al. (2021). http://doi.org/10.1111/add.15348
Collider bias an example Full card deck N (proportion) Red Not Red Face Card 6 6 (0.23) Not Face 20 20 (0.77) (0.50) (0.50) 52 Phi correlation = 0 Face cards (Jack, Queen, King): 12 cards Red cards (Hearts, Diamonds): 26 cards Phi correlation, Face with Red = 0
Collider bias an example Pick a card You are selected if: You have a face card (Jack, Queen, or King) OR Your card is red (diamond or heart) Full card deck N (proportion) Red Not Red Face Card 6 6 (0.23) Not Face 20 20 (0.77) (0.50) (0.50) 52 Phi correlation = 0 In the full deck (unselected sample), the correlation between face and red is zero
An example of collider bias on selection: Face card Red Sample selection is a collider : the outcome of multiple, (potentially) sufficient causes. Selection depends on having EITHER one or the other cause of selection. If you have one, having the other as well is conditionally less likely.
Collider bias an example In the full deck, the correlation between face and red is zero Full card deck N (proportion) Red Not Red Pick a card You are selected if: You have a face card (Jack, Queen, or King) OR Your card is red (diamond or heart) Face Card 6 6 (0.23) Not Face 20 20 (0.77) (0.50) (0.50) 52 Phi correlation = 0 In those selected, what will be the sign and size of the phi correlation?
Collider bias an example The expected distribution of the selected cards is this 62% of cards on average will be selected. The expectation distribution for selected cards is: Red Not Red Face Card 0.19 0.19 0.37 Not Face 0.63 0.00 0.63 0.82 0.19 1 If you have one cause of selection, having the other one too is relatively less likely than not having it. Phi correlation = -0.62
Collider bias causes an association between the causes of the selection Corr = -0.62 Corr = 0 Face card Red Face card Red Expected association in the population Expected association in the selected sample
What if the causes of selection are predictor and outcome? Face card Red Sample selection is a collider : the outcome of multiple, (potentially) sufficient causes. There will be a spurious association between predictor and outcome in the sample
Collider bias for smoking and covid Covid test Smoker Even if the risk and outcome are uncorrelated in the population selection is more likely for those with symptoms of covid, one of which is having a cough (which is also a symptom of smoking).
In summary People are not equally likely to be selected into a study (or to agree to participate, if randomly selected) If sample selection is related to predictors and outcomes (or the outcomes of outcomes) this will introduce collider bias In the example, both smokers and those with covid symptoms are more likely to download the app (i.e. to be selected into the study) If all this is true, smoking will be negatively related to having covid in the sample, even though in the population they may be independent (or positively related)
Another collider bias example: covid and age Data from covid-tracking apps found an association between age and infection risk. (The association between covid disease severity is well-established, but this was infection risk, not severity when infected). This was in part because people who used the app were likely to be younger, and people who had been infected were more likely to use the app. Figure 2, from: Griffith, G.J., Morris, T.T., Tudball, M.J. et al. Collider bias undermines our understanding of COVID-19 disease risk and severity. Nature Communications,11, 5749 (2020). https://doi-org.manchester.idm.oclc.org/10.1038/s41467-020-19478-2 21
The sample in this study (REACT) was a random population sample, not selected on covid-testing status. Our finding that current smokers have a lower prevalence of SARS-CoV-2 infection than non-smokers may reflect unmeasured confounding, differential adoption of preventive behaviours (given the known associations of COVID-19 severity with smoking-related co-morbidities), or there may be some biological basis.
References References Griffith et al. (2020). Collider bias undermines our understanding of COVID-19 disease risk and severity. Nature Communications, Hippisley-Cox et al. (2020). Risk of severe COVID-19 disease with ACE inhibitors and angiotensin receptor blockers: cohort study including 8.3 million people. Heart. 2020; 106: 1503-1511. Simons D, et al. (2021). The association of smoking status with SARS CoV 2 infection, hospitalisation and mortality from COVID 19: a living rapid evidence review with Bayesian meta analyses (version 7). Addiction. https://doi.org/10.1111/add.15276 Tattan-Birch, H. et al. (2021). http://doi.org/10.1111/add.15348


 was a")