Customer Retention Analysis in Streaming Services
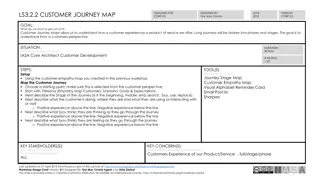
Paid streaming video services face challenges with high customer turnover rates. This project aims to use data mining techniques to enhance customer retention by identifying factors linked to turnover. The dataset includes variables like account length, area code, and usage patterns. Descriptive analytics reveal insights like unbalanced target observations and the need for oversampling. The goal is to develop predictive models to aid managerial decision-making in subscriber retention for streaming providers.

Download Presentation

Please find below an Image/Link to download the presentation.
The content on the website is provided AS IS for your information and personal use only. It may not be sold, licensed, or shared on other websites without obtaining consent from the author. Download presentation by click this link. If you encounter any issues during the download, it is possible that the publisher has removed the file from their server.
E N D
Presentation Transcript
ANALYSIS OF STREAMING PROVIDERS CUSTOMER RETENTION Project Group 7 Aaunuoluwapo Ojelade Robert Umphlet Jamie Underwood
BUSINESS PROBLEM DESCRIPTION Paid streaming video services provide entertainment content delivered via an internet connection to subscribers. The streaming industry is subject to volatile subscriber rates and high customer turnover. Competitors must learn to balance content, costs and profits to better retain subscribers. Objectives: Use data mining techniques to help increase customer retention. Uncover the factors that are linked to turnover to aid in managerial decision making. Develop models for predicting turnover/retention. Subscriber Retention Spring 2022 2
DATAOVERVIEW DATA DICTIONARY - SELECTED SOURCE Attribute Name CHURN Data Type Categorical Nominal Dependent Attribute Description A dummy variable for customer churn. 1 if customer churns (no longer a customer) and 0 if customer does not churn (remains a customer). The age of a customer s account in months Telecommunications Churn Data retrieved from Data World (Wakefield, 2019) ACCOUNT LENGTH AREA CODE DAY MINUTES Continuous Why Telecommunications? Limited public data-sets for customers of streaming services. Use telecommunications as a substitute due to similarities between industries Categorical Nominal The area code of customers Continuous The total number of minutes a customer used during the daytime in a plan period Continuous The total number of calls a customer made during the daytime in a plan period Continuous The amount a customer was charged for the minutes used during the daytime in a plan period Continuous The total number of minutes a customer used during the evening in a plan period Continuous The total number of calls a customer made during the evening in a plan period Continuous The amount a customer was charged for the minutes used during the evening in a plan period Continuous The total number of minutes a customer used during the night in a single period Continuous The total number of calls a customer made during the night in a plan period Continuous The amount a customer was charged for the minutes used during the night in a plan period Continuous The number of customer service calls a customer has made in a plan period DAY CALLS DAY CHARGE CHARACTERISTICS EVE MINUTES Target: Binary Churn EVE CALLS Observations: 12,892 EVE CHARGE Initial Attributes: 22 NIGHT MINUTES Selected Attributes: 13 NIGHT CALLS NIGHT CHARGE SERVICE CALLS Spring 2022 Subscriber Retention 3
DESCRIPTIVE ANALYTICS TARGET CHURN EXPLANATORY VARIABLES KEY TAKEAWAYS The count of calls made did not significantly vary based on the time- of-day calls were made Max range: 165 175 Median of 100 101 Unbalanced target observations Solution: data preparation step to oversample the data-set prior to further analysis Observations after oversampling: Attribute Mean Max Median Attribute minutes observed greater variation depending on time-of-day Training set 16,604 DAY MINUTES 180.16 351.5 180.0 Validation set 5,534 EVE MINUTES 200.72 363.7 201.2 NIGHT MINUTES 200.56 395.0 200.8 Subscriber Retention Spring 2022 4
MULTICOLLINEARITY ANALYSIS There appears to be direct relationship between call minutes and call charge Box Plots show DAY CHARGE, DAY MINUTES, and SERVICE CALLS with greatest difference between means for churn levels Subscriber Retention Spring 2022 5
MODELING TECHNIQUES Model 1: Logistic Regression A logistic model was used to predict the binary target churn. Model 2: PCA and Regression with Components PCA analysis was chosen to analyze the data using a method that can help reduce issues with multicollinearity between explanatory variabables. Model 3: Neural Network Neural network models typically have strong predictive abilities and can introduce non-linear functions to churn prediction Spring 2022 Subscriber Retention 6
MODEL 1: LOGISTIC REGRESSION REGRESSION RESULTS ATTRIBUTES USED IN THE MODEL: EVE MINUTES ACCOUNT LENGTH NIGHT CHARGE AREA CODE SERVICE CALLS DAY MINUTES Spring 2022 7 Subscriber Retention
MODEL 2: PRINCIPAL COMPONENTS INTERDEPENDENCE RESULTS PCA REGRESSION MODEL OMIT PC2 AND 6 Subscriber Retention Spring 2022 8
MODEL 3: NEURAL NETWORK PERFORMANCE RESULTS MODEL DIAGRAM Subscriber Retention Spring 2022 9
MODEL COMPARISONS Accuracy Specificity Sensitivity AUC Creator RSquare RASE Validation 0.685 0.705 0.721 Misclassificat ion Rate 0.2649 0.704 0.946 AUC Training 0.735 0.712 0.834 Validation 0.724 0.704 0.833 Training 0.703 0.707 0.724 Training 0.767 0.718 0.943 Validation 0.765 Training 0.792 0.753 0.872 Validation 0.784 0.748 0.873 TRAINING Logistic Regression PCA Neural Network Stepwise Logistic Regression Neural Model PCA Logistic Regression 0.2389 0.3392 0.4306 0.7919 0.5886 CHURN = no 0.3544 0.4500 0.1649 0.2896 0.8723 0.7535 CHURN = yes Stepwise Logistic Neural Network PCA Logistic Creator RSquare RASE Misclassificat ion Rate 0.2761 AUC VALIDATION Stepwise Logistic Regression Neural Model PCA Logistic Regression 0.3220 0.4352 0.7843 0.5818 0.2255 0.3583 0.4529 0.1715 0.2942 0.8731 0.7476 Subscriber Retention Spring 2022 10
CONCLUSION Neural Network Model is the best performing model Time spent consuming content is an important indicator of retention Account length, cost, and customer service attributes are also important when considering customer churn Subscriber Retention Spring 2022 11