The Two Features That Should Drive Your Choice of Business Analytics Software
Choosing the right business analytics software is crucial for driving growth and efficiency. Two key features should be at the forefront of your decision: scalability and a user-friendly interface. Scalability ensures your business analytics dashboard software can handle increasing data volumes and users as your business grows.

Download Presentation
Please find below an Image/Link to download the presentation.
The content on the website is provided AS IS for your information and personal use only. It may not be sold, licensed, or shared on other websites without obtaining consent from the author. Download presentation by click this link. If you encounter any issues during the download, it is possible that the publisher has removed the file from their server.
Presentation Transcript
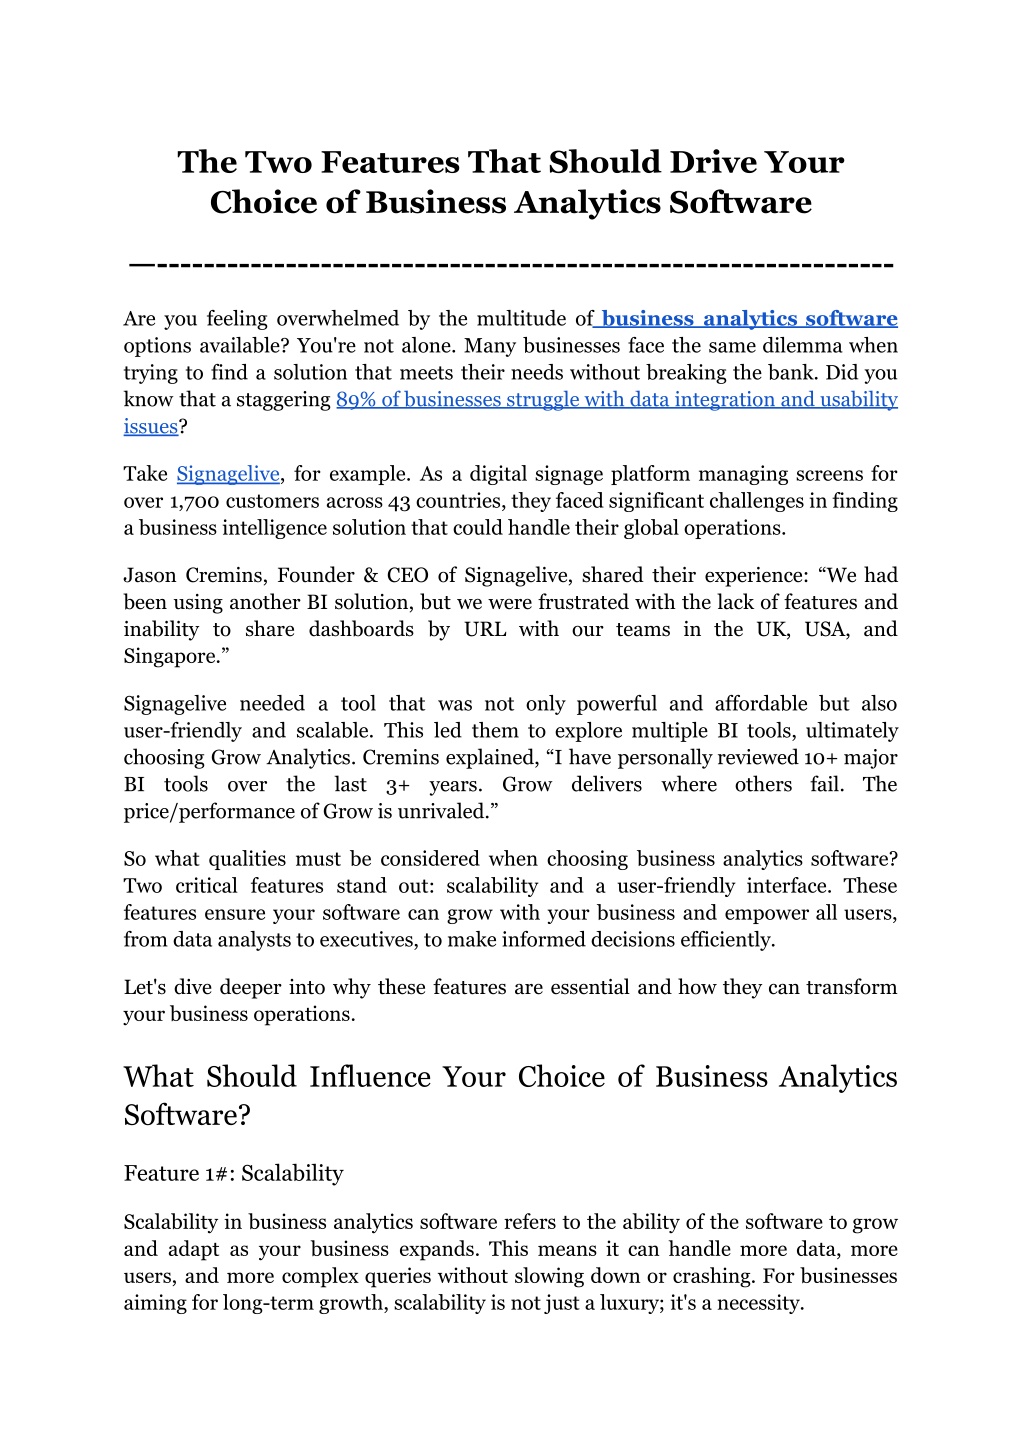
The Two Features That Should Drive Your Choice of Business Analytics Software --------------------------------------------------------------- Are you feeling overwhelmed by the multitude of business analytics software options available? You're not alone. Many businesses face the same dilemma when trying to find a solution that meets their needs without breaking the bank. Did you know that a staggering 89% of businesses struggle with data integration and usability issues? Take Signagelive, for example. As a digital signage platform managing screens for over 1,700 customers across 43 countries, they faced significant challenges in finding a business intelligence solution that could handle their global operations. Jason Cremins, Founder & CEO of Signagelive, shared their experience: We had been using another BI solution, but we were frustrated with the lack of features and inability to share dashboards by URL with our teams in the UK, USA, and Singapore. Signagelive needed a tool that was not only powerful and affordable but also user-friendly and scalable. This led them to explore multiple BI tools, ultimately choosing Grow Analytics. Cremins explained, I have personally reviewed 10+ major BI tools over the last 3+ years. Grow price/performance of Grow is unrivaled. delivers where others fail. The So what qualities must be considered when choosing business analytics software? Two critical features stand out: scalability and a user-friendly interface. These features ensure your software can grow with your business and empower all users, from data analysts to executives, to make informed decisions efficiently. Let's dive deeper into why these features are essential and how they can transform your business operations. What Should Influence Your Choice of Business Analytics Software? Feature 1#: Scalability Scalability in business analytics software refers to the ability of the software to grow and adapt as your business expands. This means it can handle more data, more users, and more complex queries without slowing down or crashing. For businesses aiming for long-term growth, scalability is not just a luxury; it's a necessity.
Impact on Business Growth 1. Handling Increased Data Volumes: Businesses produce an increasing amount of data as they expand. Scalable business analytics tools can process and analyze large datasets quickly, providing valuable insights without delay. Example: A retail company expanding its online presence might experience a surge in customer data. Scalable software ensures they can continue to analyze sales trends and customer behavior without performance issues. 2. Supporting More Users: Growing businesses often add new team members who need access to analytics dashboards. Scalable software supports multiple concurrent users, ensuring everyone gets the data they need without slowdowns. Example: An expanding financial firm using a business analytics dashboard can onboard new analysts who can all work simultaneously on the platform without affecting the system's performance. 3. Adapting to Complex Queries: As business operations become more sophisticated, so do the questions they need their analytics to answer. Scalable software can handle complex queries, providing deep insights into business performance. Example: A manufacturing company might need to analyze supply chain data to identify bottlenecks. Scalable analytics software can manage these intricate queries efficiently. Technical Aspects of Scalability Understanding the technical underpinnings of scalability helps in making informed decisions when choosing business analytics software. Key components include cloud-based architecture, data integration capabilities, and flexible storage options. Cloud-Based Architecture Elastic Resources: Cloud-based analytics platforms, like Grow Analytics, offer elastic resources that automatically adjust based on demand. This means the system can scale up during peak times and scale down during quieter periods. Example: An e-commerce site experiencing a spike in traffic during holiday sales can rely on scalable cloud-based analytics to handle the increased load seamlessly. 2
Global Accessibility: Cloud solutions provide global accessibility, allowing teams from different locations to access and collaborate on the same data in real-time. This is crucial for multinational companies or remote teams. Example: A multinational corporation can use a cloud-based business analytics dashboard to ensure all its offices worldwide have access to up-to-date data. Data Integration Capabilities Seamless Data Flow: Scalable analytics tools integrate smoothly with various data sources, ensuring a continuous flow of information. Social networking sites, ERP software, and CRM systems fall under this category. Example: A marketing agency can integrate data from multiple campaigns into a single business analytics tool, providing a comprehensive view of performance metrics. Real-Time Updates: Real-time data integration allows businesses to make decisions based on the most current information available. Scalable software ensures these updates happen without lag. Example: A logistics company can monitor fleet movements in real-time, making adjustments as necessary to improve efficiency. Flexible Storage Options Dynamic Storage Allocation: Scalable analytics software offers flexible storage solutions that grow with your data needs. This involves both on-premise and cloud storage options. Example: A healthcare provider can store and analyze patient records securely, scaling storage as the number of records grows. Cost Efficiency: By paying only for the storage you need, scalable solutions help manage costs effectively. This is especially advantageous for businesses that are small to medium-sized. Example: A startup can use scalable storage options to manage expenses while still accessing powerful analytics tools. 3
A user-friendly interface in business analytics software ensures that all users, regardless of their technical expertise, can easily navigate the tool, access necessary data, and generate actionable insights. This accessibility leads to higher adoption rates, more accurate data interpretation, and, ultimately, better decision-making. Learn about: Grow x Unlimited: Users, Dashboards, Datasets, Metrics Feature #2: User-Friendly Interface Impact on User Adoption 1. Ease of Use: Simplified navigation and intuitive design reduce the learning curve, allowing users to start leveraging the tool's capabilities quickly. Example: A financial firm adopting a business analytics dashboard with an intuitive interface saw increased usage among its analysts, resulting in more timely financial reports. 1. Increased Productivity: When users can find and analyze data effortlessly, their productivity increases. They devote more time to important activities and less time to learn about the software. Example: Marketing teams using a user-friendly business analytics tool can quickly pull campaign performance data, enabling faster adjustments and improved ROI. 1. Higher Data Accuracy: A clear and straightforward interface minimizes the risk of errors. Users can trust that they are interpreting data correctly, leading to more accurate insights. Example: Sales managers using Grow Analytics appreciate its easy-to-read dashboards, ensuring they make informed decisions based on reliable data. Key Features of a User-Friendly Interface A user-friendly interface in business analytics software is characterized by several key features that enhance usability and accessibility. These features ensure that users can fully leverage the tool's capabilities without extensive training or technical support. Intuitive Dashboards Customizable Layouts: 4
Users can tailor dashboards to display the most relevant metrics and KPIs, providing a personalized view of the data. Example: An operations manager can customize a business analytics dashboard to focus on supply chain efficiency, highlighting critical data points for daily reviews. Drag-and-Drop Functionality: Simplifies the process of creating and adjusting dashboards, allowing users to arrange data visualizations with ease. Example: A project manager can quickly build a dashboard that tracks project timelines and resource allocation using drag-and-drop features. Clear Data Visualization Interactive Charts and Graphs: Users are able to delve deeply into the data with the use of interactive components, which uncover patterns and insights that static reports could overlook. Example: Data analysts using a business analytics tool with interactive visualizations can drill down into sales data to identify regional performance variations. Consistent Design Language: A consistent design language throughout the interface makes sure that everything is clearly identifiable and understandable. Example: Executives using Grow Analytics appreciate the consistent design of its dashboards, making it easy to interpret financial data across different reports. Seamless Navigation Search and Filter Options: Advanced search and filtering capabilities help users quickly locate specific data points or reports, saving time and effort. Example: A customer service manager can use advanced search features to find historical support tickets and analyze trends in customer issues. Responsive Design: Ensures the software is accessible on various devices, from desktops to smartphones, allowing users to access data anytime, anywhere. 5
Example: Field sales representatives can access up-to-date sales figures on their mobile devices, thanks to the responsive design of their business analytics software. Practical Considerations for Choosing User-Friendly Software When selecting business analytics software, evaluating the user interface is critical. Here are practical considerations to ensure you choose a tool that is truly user-friendly. 1. User Testing: Conduct usability tests with actual users to gather feedback on the interface. This helps identify any potential usability issues before committing to a tool. 1. Training and Support: Assess the availability and quality of training resources and support. Even the most user-friendly software benefits from robust onboarding and continuous learning resources. 1. Demo and Trial Periods: Take advantage of demo versions and trial periods to explore the interface and ensure it meets your organization s needs. Encourage feedback from various departments. 1. Vendor Reputation: Research vendor reputation for customer support and product updates. A reliable vendor will continuously improve the software s usability based on user feedback. Conclusion When user-friendly interface can make a substantial difference in your organization's success. Scalable software ensures your tools can grow with your business, handling increased data volumes, supporting more users, and adapting to complex queries. A user-friendly interface, on the other hand, empowers all users to efficiently access and interpret data, driving better decision-making and higher productivity. selecting business analytics software, prioritizing scalability and a Grow Analytics embodies these critical features, offering a powerful combination of scalability and ease of use. Its cloud-based architecture ensures that your analytics can expand effortlessly as your business grows, while the intuitive design makes data accessible to everyone in your organization. 6
Ready to see how Grow can transform your business analytics experience? Take advantage of our 14-day free demo to explore its capabilities firsthand. For more insights into how Grow is helping businesses thrive, check out "Grow Reviews 2024." Invest in business analytics software that grows with you and empowers your entire team. Choose Grow for a future of data-driven success. 7