Mount Rainier Volcano Threats and Monitoring Data
Mount Rainier, with its elevation, proximity to residential areas, and geological features, poses significant volcanic hazards such as pyroclastic flows, lahars, and more. Monitoring data from USGS alert levels, seismic activity, and tilt measurements provide insights into potential volcanic activity.

Uploaded on Sep 19, 2024 | 0 Views
Download Presentation

Please find below an Image/Link to download the presentation.
The content on the website is provided AS IS for your information and personal use only. It may not be sold, licensed, or shared on other websites without obtaining consent from the author. Download presentation by click this link. If you encounter any issues during the download, it is possible that the publisher has removed the file from their server.
E N D
Presentation Transcript
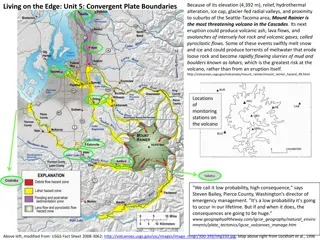
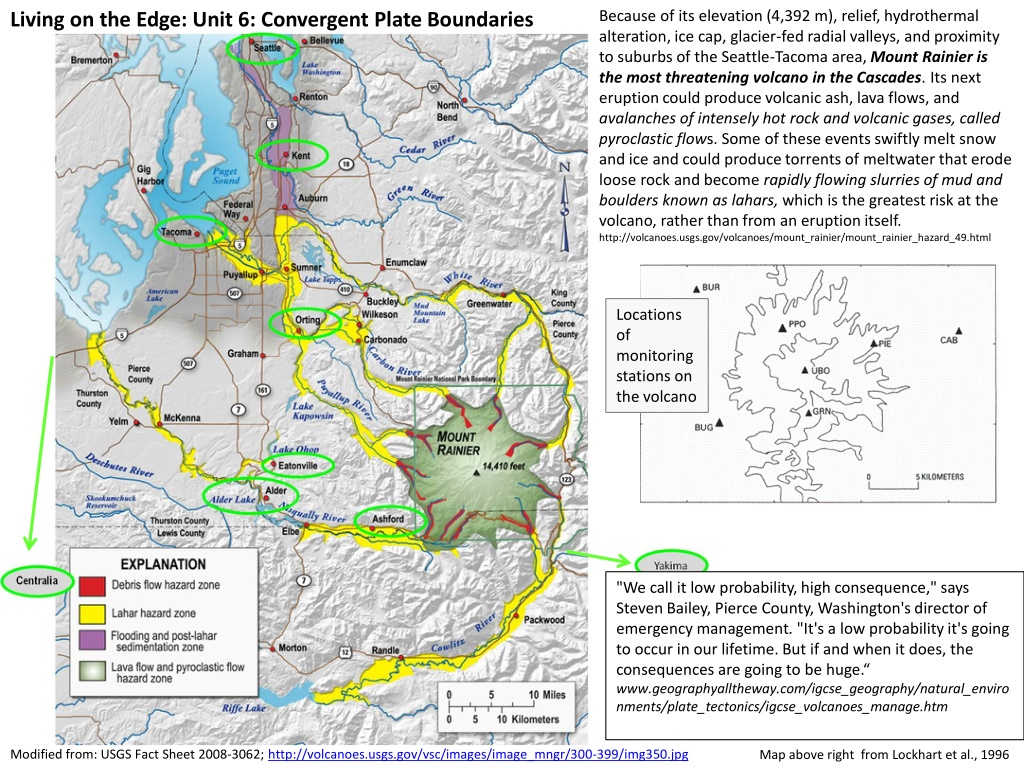
Because of its elevation (4,392 m), relief, hydrothermal alteration, ice cap, glacier-fed radial valleys, and proximity to suburbs of the Seattle-Tacoma area, Mount Rainier is the most threatening volcano in the Cascades. Its next eruption could produce volcanic ash, lava flows, and avalanches of intensely hot rock and volcanic gases, called pyroclastic flows. Some of these events swiftly melt snow and ice and could produce torrents of meltwater that erode loose rock and become rapidly flowing slurries of mud and boulders known as lahars, which is the greatest risk at the volcano, rather than from an eruption itself. http://volcanoes.usgs.gov/volcanoes/mount_rainier/mount_rainier_hazard_49.html Living on the Edge: Unit 6: Convergent Plate Boundaries Locations of monitoring stations on the volcano "We call it low probability, high consequence," says Steven Bailey, Pierce County, Washington's director of emergency management. "It's a low probability it's going to occur in our lifetime. But if and when it does, the consequences are going to be huge. www.geographyalltheway.com/igcse_geography/natural_enviro nments/plate_tectonics/igcse_volcanoes_manage.htm Modified from: USGS Fact Sheet 2008-3062; http://volcanoes.usgs.gov/vsc/images/image_mngr/300-399/img350.jpg Map above right from Lockhart et al., 1996
Living on the Edge: Unit 6: Convergent Plate Boundaries The USGS has established an alert level system to communicate the likelihood of increasing or decreasing volcanic activity. Keep these alert levels in mind as you look through the geologic activity data attached. ALERT LEVEL DESCRIPTION Volcano is in typical background, non-eruptive state or, if changing from a higher level: The activity has ceased and volcano has returned to non-eruptive background state. NORMAL Volcano is exhibiting signs of elevated unrest above known background level; or, if changing from a higher level: Volcanic activity has decreased significantly but continues to be closely monitored for possible renewed increase. ADVISORY Volcano is exhibiting heightened or escalating unrest with increased potential of eruption, timeframe uncertain, OR eruption is underway but poses limited hazards. WATCH WARNING Hazardous eruption is imminent, underway, or suspected. http://volcanoes.usgs.gov/activity/alertsystem/index.php#alertlevel Note: Data included in the following handouts are from the USGS. References for specific figures and information can be obtained from your instructor.
SEISMIC- GAS-ASH - TILT DATA SET 3: THROUGH JUNE 15
SEISMOLOGY DATA SET 3, THROUGH JUNE 15 June 12 June 14 Sections of station CAB drum records showing long-period events on June 12 (A) and on June 14 (B). Time marks represent 1-min intervals. Station PIE drum record showing (A) the eruption signals for the small eruption at 0341 and (B) the first explosive eruption at 0851 on June 12, 1991. Time marks represent 1-min intervals. Figures from Harlow et al., 1996
SEISMOLOGY and TILT DATA SET 3, THROUGH JUNE 15 Left: UBO tiltmeter with Real-time Seismic Amplitude Measurement (RSAM) data from UBO and PIE seismometers, east side of volcano. June 8-June 14 RSAM data for period of June 12-15 Map from Lockhart et al., 1996; Figure above left from Ewert et al., 1996; Figure at right from Wolfe et al., 1996
SEISMOLOGY AND GAS DATA SET 3, THROUGH JUNE 15 Recall: RSAM represents average of absolute seismic amplitudes for seismic stations. RSAM does not discriminate between types of earthquakes, but all seismic signals are averaged and recorded. Outline of areas affected by ash (tephra) fall from April 2 (outer solid red line) and the area that received light, intermittent tephra fall up to June 12 (dashed line). Inner (blue) solid outline is estimate of 1cm thick ash fall. Figures at left from Harlow et al., 1996; Figure at right modified from Paladio-Melosantos et al., 1996
OPTIONAL SEISMIC- GAS-ASH - TILT DATA SET 3: THROUGH 1 YEAR POST-ERUPTION
SEISMIC, GAS and TILT Day 2 DAY 2 POST-ERUPTION SEISMIC ACTIVITY OPTIONAL USE IN ASSESSMENT ACTIVITY RSAM (Realtime Seismic-Amplitude Measurement) data for period of June 12-22 Histogram of daily counts of high-frequency earthquakes at Mount Pinatubo April (before eruption) through December (20 months after eruption), taken from various discontinuous Comparison of all the post-eruption seismicity recorded from June 29 through August 16. Cross section is oriented west to east and shows events within a 10-km- wide strip through the summit region. Triangles are stations of the post-eruption network. records. Left-hand scale, for Yamut, PIE, and PI2; Right-hand scale, for CAB. Figures above left from Wolfe et al., 1996; lower left from Ramos et al., 1996; right modified from Mori et al., 1996
, relief, hydrothermal")