Exploring Biodiversity, Natural Selection, and Speciation in Conservation and Biodiversity (IBESS Topic 4)
Understanding biodiversity in ecosystems, the principles of natural selection according to Charles Darwin, and the concept of speciation. Explore the importance of genetic diversity, habitat diversity, and species diversity within ecosystems, and learn how natural selection drives evolution. Discover how speciation occurs through isolation and behavioral diversity, impacting the formation of new species.

Uploaded on Sep 28, 2024 | 0 Views
Download Presentation

Please find below an Image/Link to download the presentation.
The content on the website is provided AS IS for your information and personal use only. It may not be sold, licensed, or shared on other websites without obtaining consent from the author. Download presentation by click this link. If you encounter any issues during the download, it is possible that the publisher has removed the file from their server.
E N D
Presentation Transcript
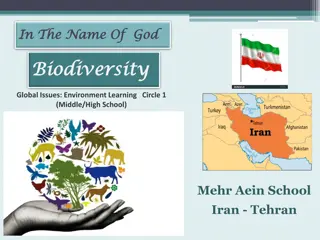
Conservation and Biodiversity IBESS Topic 4
4.1 Biodiversity in Ecosystems Biodiversity is the variety of species we have on earth, all the genetic information they carry and where they live that makes them unique. Species diversity The amount of and types of species that live within a community. Genetic diversity the variety of genetic information that can make up one type of species. Habitat diversity All the different types of ecosystems, communities and areas that a biome can have within it.
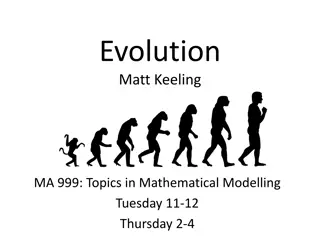
Natural Selection Charles Darwin: a Theologian by study. An avid bird watcher and Biologist by trade. Considered and investigated that all species must have had similar ancestors (fossils) and over time adapted to their environment to survive. (HMS Beagle) Natural Selection and Evolution: To Evolve is to change. Evolution is the process of organisms changing over time. Natural Selection is the mechanism that provides the oomph needed for organisms to go through the process of evolution. I have categorized Nat. Sel. into three groupings: Environmental condition Over-production of offspring (more are born than will survive) Competition for resources (i.e. living space, sunlight, food, mates) Genetic trait needed for survival and passed to offspring Each species has a varied gene pool, which leads to diverse phenotype s with in the population The Variety of genes within a population insures improved changes and adaptation to an every changing environment. Passing of these traits ensures the survival of the offspring Change is inevitable Our Earth is ever changing. The movement of the plates, changes in Atmosphere and climate, (ice-ages, global warming)
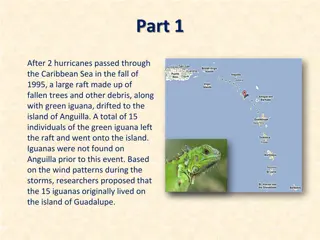
Speciation Speciation: The formation of a new species occurs when: Isolation: A species has been separated over a long period of time and adapted to their environments, genetically changing their species so they can no longer breed together. Through a geographical barrier. (little to no gene flow) i.e.: Chipmunks at the Grand Canyon, Mexican Spotted Owl and the Northern Spotted Owl, Galapagos tortoises and birds. Through Behavioral diversity. (choosing differences) Plant and Animal organisms tend to mate with others that act the same way they do. (think human cultural differences) Reproductive Isolation. Organisms that live in the same habitat mate at different times of the year. (very true for different species or sub-species of plants). Different species have different reproductive parts. Again (behavior ties in), mating rituals and niche building.
Measuring Diversity Diversity Indices: 1st: Simpson's Index (D) measures the probability that two individuals randomly selected from a sample will belong to the same species (or some category other than species). There are two versions of the formula for calculating D. Either is acceptable, but be consistent. An estimated quantitative measurement of how diverse a species is or the abundance of species within an ecosystem. Simpson s diversity index: Measures both species richness (number of ) and species evenness (abundance) D = N(N-1) n(n-1) N = total number of organisms of all species. n = total number of organisms of one species. D = 0 <>1 ; Where 0 is very diverse and 1 is little to no diversity. Site Sampling: An internet site to read: On your own time. (It may help with your group lab).
What it means Low species diversity suggests: relatively few successful species in the habitat the environment is quite stressful with relatively few ecological niches and only a few organisms are really well adapted to that environment food webs which are relatively simple change in the environment would probably have quite serious effects High species diversity suggests: a greater number of successful species and a more stable ecosystem more ecological niches are available and the environment is less likely to be hostile complex food webs environmental change is less likely to be damaging to the ecosystem as a whole
D = 1- n(n-1) N(N-1) A second way to analyze the diversity index. 0 < D > 1 Less diverse More. The inverse of the other equation. Simpson s Diversity Index can be expressed either way. I have seen this version used more frequently than the other one.
2ndShannon-Wiener Index (H) This index is determined by both the number of species and the even distribution of individuals among those species (relative dominance). It indicates the degree of uncertainty of predicting the species of a given individual picked at random from the community. In other words, if the diversity is high, you have a poor chance of correctly predicting the species of the next individual picked at random. The formula is: H = - sum(Pi ln[Pi]) Where: Pi (relative abundance) = ni/N Where: ni = number of individuals in species i N = total number of individuals in all species H (the uncertainty of predicting the species) will range from 0 for a community with a single species, to over 7 for a very diverse community. 3rdSpecies Evenness (E) Using species richness (R) and the Shannon-Wiener index (H), you can also compute a measure of evenness. The formula is: E = H/ln(R) Evenness (E) is a measure of how similar the abundance of different species are. When there are similar proportions of all species then evenness is one, but when the abundance are very dissimilar (some rare and some common species) then the value increases.
Practice 1 Number (n) 2 Species n(n-1) Woodrush Holly (seedlings) Bramble Yorkshire Fog Sedge Total (N) Use Simpson s Index to fill in the rest of the table and calculate the diversity of the habitat. 8 1 1 3 15
Practice 2 Use Shannon-Weiner Method: Numbers of individuals Flower Species Field 1 Field 2 Two different fields are sampled for wildflowers. The sample from the first field consists of 300 daisies, 335 dandelions and 365 buttercups. The sample from the second field comprises 20 daisies, 49 dandelions and 931 buttercups (see the table on right). Both samples have the same richness (3 species) and the same total number of individuals (1000). Daisy 300 20 Dandelion 335 49 Buttercup 365 931 Total 1000 1000 Diversity Measurement Community1 Community 2 Species richness (R) 3 3 Evenness (E) .9985 .3215 Dominance (high/low) Low High Relative Diversity (high/low) Shannon-Weiner Index (H) High Low 1.094 .293
Practice 3 1. Use both Simpson's index and Shannon Wiener indices to determine which of the following three communities of 100 individuals is most diverse. Community 1 contains 10 species with 91 individuals in the first species, and one individual in each of the remaining species. Community 2 also contains 10 species, but there are 10 individuals in each species. Community 3 only contains 5 species, with 20 individuals in each species.
Geological Evolution As climates shift, plates move and the terrestrial parts of the Earth change, organisms have had to adapt. When they can not adapt to the many changes, they do not survive, pass their traits to offspring (as a species). When a whole species can not adapt and survive Extinction When there are a few species left, or less species friendly habitat Endangered Areas of Endangerment Critically endangered Endangered Vulnerable Threatened
Geologic Evolution Earth was formed approximately 4.6 bya. First life forms: single cell/bacterial like organisms. lived in aquatic environments. 65 mya dinosaurs became extinct. (most recent, but not most devastating) ~200,000ya Humans were first seen on earth. Humans are relatively young on the time scale compared to some of the other organisms still living today. ex: turtles/alligators
Geological Evolution There were approx. 5 mass extinctions that have taken place over the life of the earth. Mass Extinction MYA Geological Period Estimate of loss 1st 440 Ordovician-Silurian 25% of all families 2nd 364 Devonian 19% of all families 3rd 251 Permian Triassic 95% of all species, 54% of all families 4th 199 214 End of Triassic 23% of all families, unknown % of vertebrates 5th 65 Cretaceous-Tertiary (K-T boundary) 17% of all families and all large animals including dinosaurs 6th Current Holocene Unknown
The most famous mass extinction is the K-T extinction. (Or Dinosaur extinction.) ~65 mya the dinosaurs slowly disappeared from earth. Most believe it did not happen overnight (widely debated a couple decades ago), but over a long period of time. Many thousands to hundreds of thousands years. K-T stands for Cretaceous-Tertiary. Occurring during the end of Cretaceous and beginning Tertiary Geological periods of time. Most Scientists today believe that the change in climate caused a mass extinction of the land and ocean large animals and the small plankton. Most small animals including the growing diversity of small mammals, and plants survived. The change in climate was from: several meteors hitting the earth. The most famous being in the Yucatan Peninsula of what is today known as Mexico and the volcanic unrest of Deccan Plateau of what is known as India today.
The change in climate was caused by the natural disasters of that time. Volcanoes, Earthquakes, release of carbon and methane into the atmosphere from the melting glaciers and increased sulfur and carbon into the atmosphere. The disasters caused the sun to disappear behind the haze of smoke and particulates in the atmosphere to cause heavy amounts of acid rain. This climatic change caused the amount of photosynthesis production to decrease and thus many plants died off or adapted by shrinking in size to survive. Which in turn caused less food for the plant eaters and less plant eaters for the meat eaters. And so on. (positive feedback) This also caused a change in temperature (overall global decrease) which most larger animals could not handle (thought to be exothermic).
Succession Succession is a scaffolded process of the formation or re-formation of an ecosystem to a stable state.
Conservation a careful preservation and protection of something; especially : planned management of a natural resource to prevent exploitation, destruction, or neglect Merriam-Webster dictionary
CITES Convention on International Trade in Endangered Species of Wild Fauna and Flora. CoP16 The 16thConference of the Parties March 3-14thBangkok.


")
")