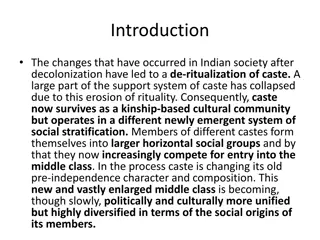
Caste Identity and Social Connections in Indian Manufacturing Sector
The study explores the impact of caste identity and social networks on productivity in Indian garment factories. It highlights the persistence of social and economic inequality based on caste, affecting poverty rates and income differentials. The research delves into how caste-based recruitment and residential networks influence workforce dynamics and outcomes.

Download Presentation

Please find below an Image/Link to download the presentation.
The content on the website is provided AS IS for your information and personal use only. It may not be sold, licensed, or shared on other websites without obtaining consent from the author. Download presentation by click this link. If you encounter any issues during the download, it is possible that the publisher has removed the file from their server.
E N D
Presentation Transcript
Caste identity, Social Connections and Financial Incentives in the Workplace A Quasi Field Experiment in India s Manufacturing Sector Farzana Afridi (ISI Delhi) Amrita Dhillon (King s College London) Sherry Xin Li (University of Texas Dallas) Swati Sharma (ISI Delhi) Stanford 2017
Social and economic Inequality in India: the caste system Legally abolished since 1950 but it continues to define hierarchy and status and is an important marker of economic inequality. Four hierarchical categories divided further into sub-castes. Endogamous. inter-caste marriages rare. Caste hierarchy is not fixed and changes form. However, there is consensus on which groups constitute the lowest level Dalits/untouchables usually engaged in degrading work. Stigmatized social identity, groups are disproportionately poor, have limited access to assets, educational opportunities and decent employment relative to higher caste groups. 2
Social and economic Inequality in India: the caste system In 2009, 45.6% of ST and 40.6% of SC as against 30% of OBC and 17.6% of high castes were under the poverty line (Panagriya and More, 2013). Borooah (2005) estimates that at least 1/3rd of the difference in incomes between households is attributable to discrimination against SC/ST households. 3
Migration and caste networks in the urban workforce With modernization, structural transformation demand for urban labour force increased, leading to increased migration more than 80% of workforce in NCR garment manufacturing is migrant labour. Caste based recruitment and residential location caste is the salient network (Munshi, 2016). A natural question is to ask: do social networks mediated by caste help to improve productivity/wages/inequality and if so, how? How do financial incentives affect outcomes? 4
Factory data from NCR India We investigate these questions in the private sector garment factories. We use factory data to show correlations: the higher the proportion of the same caste in the team, the higher is productivity. This is without financial incentives. 5
Daily, worker level data on within firm worker productivity Individual worker efficiency Line level efficiency Individual worker efficiency (3) Line level efficiency (1) (2) (4) Proportion of workers of own caste category in the assembly line 0.071** (0.031) 0.057*** (0.019) Standard deviation of proportion of workers in own caste category in assembly line across work days -0.164* (0.091) 0.347*** (0.094) 0.0485 -0.154* (0.087) 0.334*** (0.074) 0.1940 Constant 0.202*** (0.044) 0.0474 0.200*** (0.022) 0.1850 R2 N 33,704 33,704 33,702 33,702 Notes: Controls include factory floor fixed effects, worker s individual characteristics. Robust standard errors, clustered at the assembly line level.Significant at *10%, **5% and ***1%. Checked separately for stricter regressions: worker and line fixed effects and daily trends. A 1% increase in proportion implies 7% increase in efficiency. 6
Interaction between financial and social incentives? In the factory we see that diversity in the assembly line leads to lower productivity. To reduce the across caste inequality therefore it might be better to have homogeneous groups Tension between benefits of integration in the long term and reducing social inequality. Can financial incentives substitute for social incentives to cooperate within an assembly line? 7
Experiment We conduct a lab experiment using garment factory workers as recruits. We try to replicate the conditions of the assembly line in the factory but we give team incentives based on minimum output across workers in the team. Look at homogenous groups: same caste, living in the same neighbourhoods, friends with each other vs heterogenous groups with mixed caste groups, no locational proximity, no friends. 8
Results Being in a socially connected (same caste) group increases group output by 15%. Wasted effort is 30% lower for socially connected groups. This result is driven by low caste workers. Closer connections to each other other caste groups are more heterogeneous. Shared identity of victimhood. This explanation is less likely as caste identity was not primed in our design. Interaction between financial incentives and social connections: the bonus framing generates significantly more effort when groups are socially connected vs unconnected: complementarity, not substitutability! 9
Main message for the workshop In our setting financial incentives (commodification of voluntary public goods provided by caste members to each other which can help to increase productivity) also help to reduce between group inequality in a very narrowly defined sense: low caste groups do better than high caste. 10
Inequality Trends in Caste Munshi (2016): trend is of convergence of caste groups in income, education, employment, occupations and access to public goods. While he attributes some of this to affirmative action, he suggests that caste based networks could have contributed to this trend by exploiting opportunities provided by development. In our setting, groups are exogenously formed but if employers are aware of the advantages of homogenous groups we may observe more of these groups to exploit the greater trust and public good provision within castes. 11
Experiment Location: Delhi- National Capital Region s garment factory hub Time line: May - July 2016 Subjects: Garment factory workers recruited through advertisements in their residential areas 12
Experiment Subjects details on caste, jati and current residence recorded during registration. Subjects randomly assigned into one of the following groups: Homogeneous social identity: same caste group and same current residence Heterogeneous social identity: different caste group and different current residence Each group consisted of 4 subjects of same gender Assigned individual task: Fill as many 20 cm. wires with beads of one of four assigned colors in 10 minutes. Group output: Bracelets, each consisting of four colored strings. 13
Experiment Priming of group social identity by announcing names & residence in all sessions: | | | - 14
Experiment: Financial incentives Number of bracelets produced by group Subject payoff (Rs.) Piece rate Bonus 1 100 100 2 200 200 3 300 300 4 400 400 5 500 500 + 150 =650 6 600 600 + 150 =750 7 700 700 + 150 =850 . Note: Rs. 200 participation fee; 100% or more of the daily wage of a garment factory worker. In bonus with loss framing the payment schedule was given to subjects in reverse order, i.e. starting with 7 or more bracelets and moving down to 1 bracelet to produce a sense of loss if they do not meet the threshold. 17
Data Number of Subjects Number of sessions Incentive group Homogeneous Heterogeneous Homogeneous Heterogeneous All (Male) 7 13 13 33 (Male) 9 12 13 34 (Female) 6 12 12 30 (Female) 8 14 12 34 Piece Rate Bonus (Gains) Bonus (Loss) 30 51 50 131 120 204 200 524 18
Methodology Yis = 0 + 1 Socially Connecteds + 2 Xs + 3 Zi+ i Yis = effort and co-ordination of subject i in session s Socially Connecteds =1 if group members have same caste identity Xs = dummy for piece rate or bonus framing Zi = age, caste category, marital status, religion, native state, employment status, education 19
Low caste are most responsive to being in homogenous group, irrespective of gender Excess Individual Effort High Group Effort Group Dispersion Individual Output Payoff Group Output (4) (5) (6) (1) (2) (3) Homogeneous 0.461*** (0.175) 0.093 (0.216) 0.319* (0.174) -0.406 (0.311) -0.504** (0.214) 5.404*** (0.336) 101.1** (39.04) 14.66 (14.83) 16.59 (16.16) -41.86 (53.59) -109.0** (45.73) 488.9*** (72.61) 0.870*** (0.221) 0.115 (0.131) 0.126 (0.138) -0.599* (0.335) -0.903*** (0.298) 4.192*** (0.482) -0.409* (0.208) -0.0223 (0.201) 0.194 (0.201) 0.193 (0.321) 0.399 (0.282) 1.212*** (0.442) 0.050 (0.145) 0.026 (0.034) 0.021 (0.032) 0.037 (0.193) -0.034 (0.154) 0.384* (0.220) -0.234* (0.123) -0.057 (0.067) -0.011 (0.065) -0.002 (0.191) 0.193 (0.150) 0.795*** (0.195) H M H x Homogeneous M x Homogeneous Constant Homogeneous group effect on L 0.461*** (0.175) -0.043 (0.139) 0.054 (0.246) 524 101.1** (39.04) -7.922 (30.968) 59.203 (43.071) 524 0.870*** (0.221) -0.033 (0.238) 0.271 (0.306) 524 -0.409* (0.208) -0.010 (0.202) -0.216 (0.263) 524 0.050 (0.145) 0.162 (0.082) 0.088 (0.140) 524 -0.234* (0.123) -0.042 (0.108) -0.236 (0.167) 524 M H N R2 0.148 0.097 0.081 0.079 0.087 0.103 Notes: Controls include age, dummy for female, married, Hindu, primary schooling complete, native state is Bihar, and currently employed and type of financial incentive. Standard errors clustered at session level in parenthesis. Significant at *10%, **5% and ***1%. 22
Interaction between social and financial incentives Yis = 0 + 1 Socially Connecteds + 2 Bonus-Gain Framings + 3 Bonus- Loss Framings + 4 Socially Connecteds Bonus-Gain Framings + 5Socially Connecteds Bonus-Loss Framings + 6 Xs + 7 Zi+ i 23
Summary Males respond positively to being in-network through better within group co-ordination and higher group output. Low caste males and females, together, show the strongest positive response to being in group. High powered incentives do not improve productivity over and above piece rates based on team performance. In some cases, loss framing reduces the productivity. 28
Summary Interaction effects: Higher financial incentives help to improve coordination and reduce wasted effort for socially connected workers relative to unconnected workers, no significant effect on output (complementarity) Especially for low and M type workers- a network effect that helps to reduce inequalities. H caste coordinate better in the heterogenous group with higher powered incentives (substitutability). Suggests that affinity is higher in the L groups relative to others. 29
Mechanisms? (1) Taste based discrimination: altruism within caste encourages higher effort within a team. Experimental set up rules out peer pressure or inequity aversion. Statistical Discrimination: expectations on ability differ across caste groups. More accurate perceptions within caste, together with self fulfilling beliefs on ability towards other castes. (2) In our setting in addition there are multiple equilibria and maybe shared norms on effort helps to coordinate on the better equilibrium. 30
Conclusion The organization of workers within a firm can have significant consequences for group productivity and inequality. When production process requires coordination among workers, shared social identity can enhance group productivity due to altruism or beliefs on ability/effort and shared norms. This has important implications for inequality, our results suggest that castes with deep affinity will benefit the most from this kind of homogeneity in team composition at the factory. 31