Understanding Lake Tahoe's Environmental Challenges
The Lake Tahoe Total Maximum Daily Load (TMDL) program aims to restore Lake Tahoe's clarity by addressing pollution sources such as nitrogen, phosphorus, and fine sediment particles. The program involves a science phase, regulatory strategy phase, and implementation phase to reduce pollutant loading and improve water quality. Sources of nitrogen and phosphorus include shoreline erosion, groundwater, atmospheric deposition, urban and non-urban upland sources, and stream channel erosion. Fine sediment particles come mostly from urban upland areas. Progress in reducing pollutant loading and enhancing lake clarity continues to be monitored and assessed.

Download Presentation

Please find below an Image/Link to download the presentation.
The content on the website is provided AS IS for your information and personal use only. It may not be sold, licensed, or shared on other websites without obtaining consent from the author. Download presentation by click this link. If you encounter any issues during the download, it is possible that the publisher has removed the file from their server.
E N D
Presentation Transcript
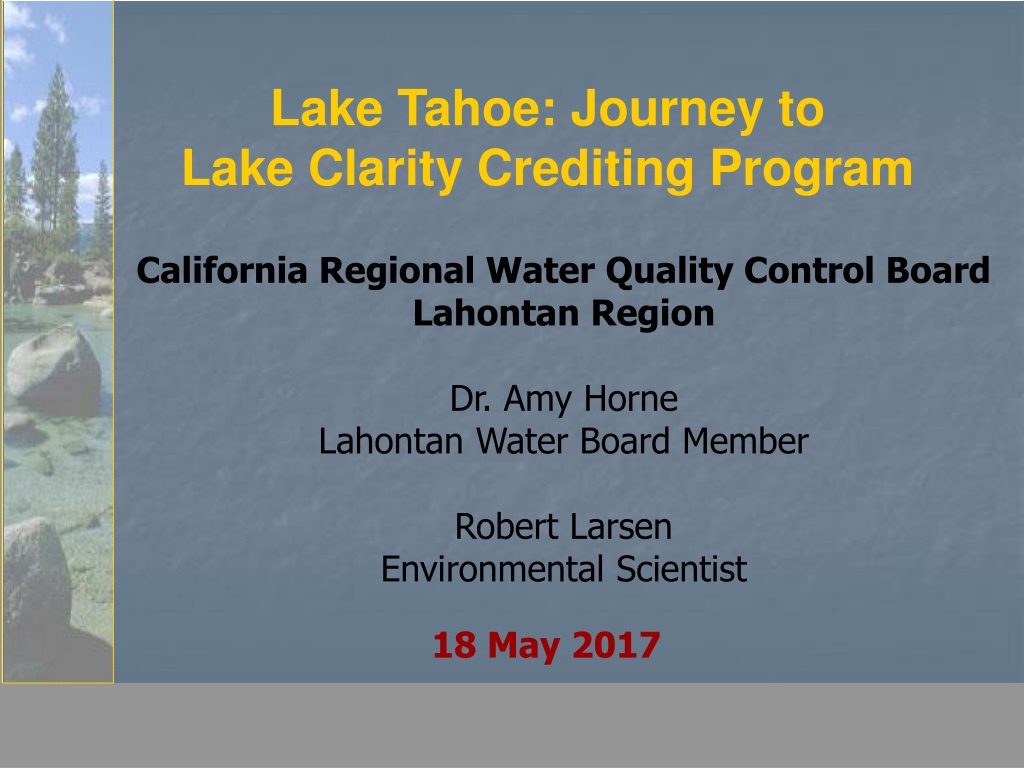
Lake Tahoe: Journey to Lake Clarity Crediting Program California Regional Water Quality Control Board Lahontan Region Dr. Amy Horne Lahontan Water Board Member Robert Larsen Environmental Scientist 18 May 2017
What is the Lake Tahoe TMDL? A science-based plan to restore Lake Tahoe s clarity 18 May 2017 2
Lake Tahoe TMDL Phases Science Phase (1959 2010) What pollutants are causing clarity loss? How much of each pollutant reaches the lake? How much of each pollutant can the lake receive and still meet clarity goal? Regulatory Strategy Phase (2005 2010) What strategy should we use to reduce pollutant loading? How do we regulate pollutant load reduction? Implementation Phase (2010 2075?) Are we achieving expected reductions in pollutant loading? Is lake clarity improving? 18 May 2017 3
Science Phase: 1959 - 2010 1959: Dr. Charles Goldman began monitoring lake clarity Initial hypothesis: N, P causing clarity loss 1968: All wastewater exported from Tahoe Basin Remaining N, P from non-point sources 2005: Scientists find new culprit: fine sediment particles (FSP) 18 May 2017 4
What are the Sources of Nitrogen? Total Nitrogen Estimates: Percent Contribution per Source Category Shoreline Erosion 0.5% Groundwater 12.5% Atmospheric Deposition 55% Urban Upland 16% Non-urban Upland 15.5% Stream Channel Erosion 0.5% 18 May 2017 5
and Phosphorus? Total Phosphorus Estimates: Percent Contribution per Source Category Shoreline Erosion 4% Groundwater 15% Urban Upland 38% Atmospheric Deposition 15% Stream Channel Erosion 2% Non-urban Upland 26% 18 May 2017 6
and Fine Sediment Particles? Fine Sediment Particle Number Estimates (particles less than 20 micrometers): Percent Contribution per Source Category (particles less than 16 micrometers) Stream Channel Erosion 4% Atmospheric Deposition 15% Non-urban Upland 9% Shoreline Erosion < 1% Urban Upland 72% 18 May 2017 7
TMDL Science Conclusions Two- thirds of clarity loss caused by FSP (<16 micrometers) Total FSP Load = 481 x 1016 Particles Need to reduce FSP load by 32% to reverse clarity loss Urban accounts for 72% of FSP 18 May 2017 8
Regulatory Strategy Phase 2005 - 2010 For each source category, experts quantified different options to reduce N, P, FSP loads TMDL implementation strategy based on cost- effectiveness and feasibility 18 May 2017 9
FSP Load Reduction Targets 3.50E+20 3.00E+20 Number of Particles Baseline Load Clarity Challenge Reduction 34% 2.50E+20 2.00E+20 1.50E+20 1.00E+20 31% 12% 5.00E+19 53% 0.00E+00 Urban Atmospheric Forest Streams Current Particle Load and Percent Reduction Target 10
Urban FSP Reduction Timeline 70 % FSP Load Reduction 60 50 40 30 2021 target 20 10 0 5 10 15 20 25 30 35 40 45 50 55 60 65 2016 target Time in Years 18 May 2017 11
Municipal NPDES Storm Water Permit Performance based regulation Requires municipalities to reduce FSP as percent of 2004 baseline Loading time step is average annual Actions to reduce FSP also reduce N, P 18 May 2017 12
Storm Water Permittees Placer County El Dorado County City of South Lake Tahoe (CalTrans: Tahoe- specific requirements) 18 May 2017 13
Implementation Phase 2010 2075? Challenges: Link action to expected benefits Track progress at municipal and annual scales Encourage jurisdictions to cooperate 18 May 2017 14
Lake Clarity Credit Standard Metric One Lake Clarity Credit = 1 x 10¹⁶ FSP 18 May 2017 15
Lake Clarity Credit Targets Minimum Number of Credits Jurisdiction 2016 2021 220 El Dorado 342 Placer 260 554 South Lake Tahoe 190 521 18 May 2017 16
The Lake Clarity Crediting Program Process 18 May 2017 17
Many Ways to Earn Credits 18 May 2017 18
Municipality Prioritizes Actions to Earn Credits Emphasis on surface water connectivity Modelling tools facilitate meaningful alternatives analysis Credit award requires demonstrated maintenance 18 May 2017 19
Lake Clarity Crediting Program & Implementation Tools Urban Catchment Pollutant Load Reduction Model Private BMPs & Muni Ordinances WQ Improvement Projects Road Operations Storm Water Treatment Reduce Pollutant Potential (Source Control) Rapid Assessment Methods Inspect & Enforce Sand & Sweep Maintain BMPs Accounting and Tracking Software 18 May 2017 20
Lake Clarity Crediting Program 18 May 2017 21
Sharing Credits Across Jurisdictions City/CalTrans/Private Property and $$ Capital Cost >$15M Community facilities district funds maintenance 18 May 2017 22
LCCP Report Card Water Board: Focuses municipalities on effective actions Creates incentives for innovation Links project-level actions to Lake Tahoe TMDL Municipalities: Program flexibility Regulatory predictability Opportunities to cooperate 18 May 2017 23
LCCP Report Card Funding Agencies: Guidance for awarding grants Evaluate project effectiveness Stakeholders: Most accept regulatory strategy Some distrust models Equity concern 18 May 2017 24
LCCP Report Card Lessons Learned: Develop tools concurrent with policy Provide consistency and predictability Share risks associated with uncertainty Continually update tools and software to incorporate new science Regularly engage with partners to adaptively manage the program 18 May 2017 25
Is Lake Clarity Improving? 18 May 2017 26
Questions? 18 May 2017 27