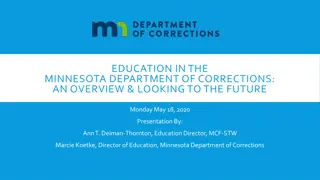
2015 Leadership Conference: Achieving Results Together in Minnesota
Explore how Minnesota's Department of Education is improving graduation rates for American Indian and Black students with disabilities through focus groups to determine root causes. By analyzing quantitative data and engaging in evidence-based practices, the initiative aims to address disparities and enhance educational outcomes.
- Leadership Conference
- Minnesota Department of Education
- Graduation Rates
- Focus Groups
- Educational Improvement

Download Presentation

Please find below an Image/Link to download the presentation.
The content on the website is provided AS IS for your information and personal use only. It may not be sold, licensed, or shared on other websites without obtaining consent from the author. Download presentation by click this link. If you encounter any issues during the download, it is possible that the publisher has removed the file from their server.
E N D
Presentation Transcript
2015 Leadership Conference All In: Achieving Results Together 2015 Leadership Conference All In: Achieving Results Together Root Cause is Critical to Improvement! Barbara L. Troolin, Ph.D., Director Carolyn J. Cherry, Ed.D., Part B Data Manager Minnesota Department of Education Sandy Schmitz, Ph.D. Tri Tran, B.S., Analyst University of Minnesota, Systems Improvement Group 1
Session Agenda Minnesota and our SIMR Using focus groups to help determine root cause Shared Learning Next Steps Discussion 2
Minnesota: Land of More than 10,000 lakes and 857,000 students The Mississippi Headwaters and Mall of America 11 Tribal Nations and 120+ spoken languages Mary Tyler Moore, Betty Crocker and Prince 150 charter schools and over 128,000 special education students Inventions (oxygen mask, scotch tape and zubazs) and foods like Spam and Lutefisk 3
MDE State Identified Measurable Result Statewide 6-year Graduation Rate for American Indian and Black students with disabilities (SWDs) Statewide data shines a light across Minnesota 6-year rate allows us to tell a story not reflected in other federal and state reporting 4
MDE State Identified Measurable Result Statewide 6-year Graduation Rate for American Indian and Black students with disabilities (SWDs) Graduation aligns with other state initiatives American Indian and Black SWDs have chronic lower graduation and higher dropout rates that other student groups with disabilities 5
Why Focus Groups to Help Determine Root Cause? Quantitative data doesn t tell the whole story Identifying areas over which we have control and influence Using data from multiple sources to determine best choices for evidence- based practices 6
Focus Group Overview Two focus groups in each of four pilot districts District Administrators 30 participants 1.5-2 hour sessions Student with Disabilities American Indian and Black SWDs for whom graduation had been delayed 26 participants 1 hour sessions 7
Open-Ended Evaluation Questions Topics included: 1. Most significant factors for low graduation 2. How districts engage families 3. How data are used 4. Current initiatives to improve graduation 5. District capacity and needed MDE support 6. What districts need to do in the next 5 years 8
Administrator Comments Coded into 21 categories Topical Areas included areas around: District Professional Development and Initiatives Cultural Competency and Awareness Special Education Processes, Funding and Placement Student and Family Perspectives and Engagement 9
Topic: Most Significant Factors Categories accounting for 71% of responses: Cultural awareness Changing Demographics Transition & Career Consequences of SPED placement Engagement & Retention Parent Support 10
Topic: How Districts Engage Families Categories accounting for 67% of responses: Parents & Families district has large dependence on cultural liaisons & district equity offices Cultural Awareness District Initiatives few aimed at students who are Black or American Indian with disabilities 11
Topic: How Data are Used Categories accounting for 52% of responses: Types of data collected no evidence of data collection efforts specifically relating to students who are American Indian or Black with disabilities District initiatives usually left to specialized units 12
Topic: Interventions When Progress is Not Made Categories accounting for 53% of responses: District initiatives Low Expectations Data collection to identify at-risk students 13
Topic: District Initiatives to Improve Graduation Categories accounting for 51% of responses: Collaboration with American Indian Community Cultural awareness Shared responsibility 14
Topic: District Capacity & Needed MDE Support Categories accounting for 34% of responses: Partnering with teacher preparation programs Putting efforts into recruiting diverse special education teachers MDE could provide more trainings MDE needs to increase involvement in racial equity work 15
Topic: Next 5 Years Categories accounting for 50% of responses: Professional Development and Training Cultural Awareness Leadership and Systemic Issues 16
Student Focus Groups Students used district and school interchangeably Some questions had to be reframed for students so they were clear on what was being asked Comments were coded into 3 themes 17
Student Focus Groups: Contributing Factors Contributing Factors that Lead to Lower Graduation Rates for Black and American Indian Students (N=26) 52% Not getting enough help from teacher 48% Low teacher expectation Preferential treatment for White and non- disabled students 36% Lack of family, school, and community support 20% 20% Low student expectation 16% Lack of cultural understanding 16% Lack of effort from student 12% Lack of differentiated instruction 4% Lack of safe learning environment 18 0% 10% 20% 30% 40% 50% 60%
Student Focus Groups: Things District Needs to Change Student Focus Group Report Things District Needs to Change to Improve Graduation Rates for Black and American Indian Students with Disabilities (N=26) High teacher expectation 44% Self-advocacy/setting IEP goals 28% More differentiated instruction 24% Resource room/alternate learning program 24% Teacher engagement 20% Smaller class size 20% Family/community involvement 20% Cultural competence 16% More equity 12% More access to counselor/advisor/mentor 12% Theatre and arts 8% Co-teaching 8% Better classroom management 8% School engagment 4% 0% 5% 10% 15% 20% 25% 30% 35% 40% 45% 50% 19
Student Focus Groups: Student and Family Engagement How the District Engages Families(N=26) IEP/accommodation/self-advocacy 40% Teacher/counselor/case manager engagement 32% Regular communication 28% Lack of school engagement 4% After school program 4% 0% 5% 10% 15% 20% 25% 30% 35% 40% 45% 20
Shared Learning Pilot Partner District Meetings and Report Sharing MN Association of Special Educators- Spring Best Practices Conference Agency and Stakeholder Communications 21
Next StepsPhase II Additional Focus Groups, Data Gathering Teachers, Staff Parents District Level Data Deeper Dive Determine evidence-based practices based on data 22
Discussion Question 1 What strategies did your state use, or will your state use, to determine root cause in addressing your State Identified Measureable Result (SIMR)? 23
Discussion Question 2 What external stakeholders or consumers did you include to determine root cause? 24
Discussion Question 3 Based on what you heard today, how will this information inform next steps in your state to make progress on your SIMR? 25
Thank you!!! Questions? Comments? 26