Understanding China's Economic Growth Through Macroeconomics Analysis

Explore the intricate details of China's GDP evolution, real GDP growth, and the concepts of intermediate macroeconomics. Dive into the circular flow, GDP imputation, deflators, and more as you analyze China's economic performance from 1953 to 2022. Uncover the interplay between nominal and real GDP, grasp the significance of Sherlock Holmes' quote in economic analysis, and unravel the mysteries of GDP calculations.

Uploaded on Sep 30, 2024 | 0 Views
Download Presentation

Please find below an Image/Link to download the presentation.
The content on the website is provided AS IS for your information and personal use only. It may not be sold, licensed, or shared on other websites without obtaining consent from the author. Download presentation by click this link. If you encounter any issues during the download, it is possible that the publisher has removed the file from their server.
E N D
Presentation Transcript
Sherlock Holmes: It is a capital mistake to theorize before one has data. Insensibly one begins to twist facts to suit theories, instead of theories to fit facts. Intermediate Macroeconomics
(Gross Domestic Product, GDP) GDP: [ ] [ ] income [ ] expenditure Intermediate Macroeconomics
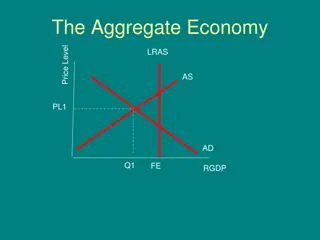
The Circular Flow Intermediate Macroeconomics
GDP GDP: ???????, ????= ?=1 ??? ??? ? ? 20 30 , 0.5 1 GDP = ( ) + ( ) = (0.5 20) + (1.0 30) = 40 Intermediate Macroeconomics
GDP: imputation Intermediate Macroeconomics
GDP: GDP = = Intermediate Macroeconomics
GDP: GDP GDP Intermediate Macroeconomics
GDPGDP GDP nominal GDP current price ????= ?=1 GDP GDP real GDP constant price ?????= ?=1 ?0 base period ???0 . GDP GDP GDP ????= ?? ?????, ?? GDP GDP deflator, or implicit price deflator for GDP ???????. ???????0, Intermediate Macroeconomics
GDP1978-2022 China's Real GDP and Nominal GDP (unit: RMB 100million) 1401000 1201000 1001000 801000 601000 401000 201000 1000 1978 1979 1980 1981 1982 1983 1984 1985 1986 1987 1988 1989 1990 1991 1992 1993 1994 1995 1996 1997 1998 1999 2000 2001 2002 2003 2004 2005 2006 2007 2008 2009 2010 2011 2012 2013 2014 2015 2016 2017 2018 2019 2020 2021 2022 Real GDP (2010 Price) Nominal GDP Intermediate Macroeconomics
GDP1953-2022 China Real GDP Growth (Annual, %) 30 20 10 0 (10) (20) (30) 1953 1955 1957 1959 1961 1963 1965 1967 1969 1971 1973 1975 1977 1979 1981 1983 1985 1987 1989 1991 1993 1995 1997 1999 2001 2003 2005 2007 2009 2011 2013 2015 2017 2019 2021 Intermediate Macroeconomics
GDP , 1992Q1-2023Q2 China Real GDP Growth (Quarterly, %) 20 15 10 5 0 (5) (10) 1992-03 1992-12 1993-09 1994-06 1995-03 1995-12 1996-09 1997-06 1998-03 1998-12 1999-09 2000-06 2001-03 2001-12 2002-09 2003-06 2004-03 2004-12 2005-09 2006-06 2007-03 2007-12 2008-09 2009-06 2010-03 2010-12 2011-09 2012-06 2013-03 2013-12 2014-09 2015-06 2016-03 2016-12 2017-09 2018-06 2019-03 2019-12 2020-09 2021-06 2022-03 2022-12 Intermediate Macroeconomics
Chinese GDP at 2022 2022 GDP 121 . GDP 85698 . (7) , GDP 12385 . , 2022 GDP 76328 Intermediate Macroeconomics
30 30 2020 1995 , chain-weighted GDP Chain-weighted GDP 2000 GDP 1. 1999 2000 GDP 2. 2000 2000 GDP 5 Intermediate Macroeconomics
GDP Y = C + I + G + NX (GDP) Intermediate Macroeconomics
(C) (C) durable goods Intermediate Macroeconomics
% % 60 50 40 30 20 10 0 1978 1979 1980 1981 1982 1983 1984 1985 1986 1987 1988 1989 1990 1991 1992 1993 1994 1995 1996 1997 1998 1999 2000 2001 2002 2003 2004 2005 2006 2007 2008 2009 2010 2011 2012 2013 2014 2015 2016 2017 2018 2019 2020 2021 2022 Intermediate Macroeconomics
(I) (I) private sector Intermediate Macroeconomics
: 1/1/2002: 500 2002 : = 100, = -20 1/1/2003: : 500+100-20=580 stock flow Intermediate Macroeconomics
% % 60.0000 50.0000 40.0000 30.0000 20.0000 10.0000 0.0000 1978 1980 1982 1984 1986 1988 1990 1992 1994 1996 1998 2000 2002 2004 2006 2008 2010 2012 2014 2016 2018 2020 2022 Intermediate Macroeconomics
GDP GDP 14 12 10 8 6 4 2 0 1978 1979 1980 1981 1982 1983 1984 1985 1986 1987 1988 1989 1990 1991 1992 1993 1994 1995 1996 1997 1998 1999 2000 2001 2002 2003 2004 2005 2006 2007 2008 2009 2010 2011 2012 2013 2014 2015 2016 2017 2018 2019 2020 2021 2022 Intermediate Macroeconomics
(G) transfer payments Intermediate Macroeconomics
% % 20 18 16 14 12 10 8 6 4 2 0 1978 1979 1980 1981 1982 1983 1984 1985 1986 1987 1988 1989 1990 1991 1992 1993 1994 1995 1996 1997 1998 1999 2000 2001 2002 2003 2004 2005 2006 2007 2008 2009 2010 2011 2012 2013 2014 2015 2016 2017 2018 2019 2020 2021 2022 Intermediate Macroeconomics
?? ?? ??, ??, ??, ??. ? = ??+ ??,? = ??+ ??,? = ??+ ??. ?? ?? ? = ?? ?? ?? = ??+ ??+ ??. ? = ??+ ??+ ??+ ??+ ??+ ??+ ?? ??+ ??+ ??. Intermediate Macroeconomics
GDP GDP GDP= + + + -> + -> -> GDP GDI (Gross Domestic Income) Intermediate Macroeconomics
GNI (Gross National Income) GNP (Gross National Product) GNI = GDP + NNP (Net National Product) NNP = GNP Depreciation NI (National Income) NI NNP statistical discrepancy PI (Personal Income) Disposable PI Intermediate Macroeconomics
GNIGDP (GNI-GDP)/GDP*100 (%) 1.0 0.5 0.0 (0.5) (1.0) (1.5) (2.0) 1981 1982 1983 1984 1985 1986 1987 1988 1989 1990 1991 1992 1993 1994 1995 1996 1997 1998 1999 2000 2001 2002 2003 2004 2005 2006 2007 2008 2009 2010 2011 2012 2013 2014 2015 2016 2017 2018 2019 2020 2021 2022 Intermediate Macroeconomics
CPI CPI (Consumer Price Index) CPI, ???,?0??? ???,?0??,?0 ??? ? ? , ??,?0 ?0 , ??,?0 ?0 , ?0 100 100 CPIt= c0 , Intermediate Macroeconomics
CPI ?? ? CPI ?0 ??= ??,?0??,?0/ ?=1 ? ???,?0??,?0 ??? ??,?0 CPIt= ?0 ?? . ?=1 Intermediate Macroeconomics
Year Apple Orange Price Quantity Price Quantity 2016 0.6 25 1.1 15 2015 0.5 20 1 10 2016 CPI ???2016= 100 0.6 20 + 1.1 10 0.5 20 + 1 10 2+1.1 1 2 0.6 0.5 1 1 = 100 = 115. Intermediate Macroeconomics
CPI w? ??? CPI : ??? ??,? 12 ?? 1 100%. ? CPI ??? ??,? 1 ?? 1 100%. ? Intermediate Macroeconomics
CPI% China's Monthly Inflation Rate (%) 30 25 20 15 10 5 0 (5) 1987 1987 1988 1989 1990 1991 1992 1992 1993 1994 1995 1996 1997 1997 1998 1999 2000 2001 2002 2002 2003 2004 2005 2006 2007 2007 2008 2009 2010 2011 2012 2012 2013 2014 2015 2016 2017 2017 2018 2019 2020 2021 2022 2022 Intermediate Macroeconomics
CPI % 30.15 20.57 11.81 11.36 10.83 8.27 3.83 3.16 Intermediate Macroeconomics
CPI Intermediate Macroeconomics
GDP ?0 GDP GDP deflator ? ?=1 ?=1 ?????? ?????,?0 ?? ??= ??= ? ?? ?0 ? GDP ?? ? GDP GDP ?it= ?????,?0/ ?=1 ? ??????,?0, ??? ??,?0 ??= ??? ?=1 Intermediate Macroeconomics
GDPCPI GDP GDP GDP CPI GDP CPI GDP CPI GDP CPI Intermediate Macroeconomics
Inflation in CPI and GDP Deflator Annual Inflation 30 25 20 15 10 5 0 -5 1979 1980 1981 1982 1983 1984 1985 1986 1987 1988 1989 1990 1991 1992 1993 1994 1995 1996 1997 1998 1999 2000 2001 2002 2003 2004 2005 2006 2007 2008 2009 2010 2011 2012 2013 2014 2015 2016 2017 2018 2019 2020 2021 2022 Inflation in CPI Inflation in GDP Deflator Intermediate Macroeconomics
CPI / / Intermediate Macroeconomics
CPI Core CPI PCE price index Core PCE price index Producer s price index, PPI Intermediate Macroeconomics
PPICPI Inflation in CPI and PPI 15 10 5 0 (5) (10) 1996-10 1997-06 1998-02 1998-10 1999-06 2000-02 2000-10 2001-06 2002-02 2002-10 2003-06 2004-02 2004-10 2005-06 2006-02 2006-10 2007-06 2008-02 2008-10 2009-06 2010-02 2010-10 2011-06 2012-02 2012-10 2013-06 2014-02 2014-10 2015-06 2016-02 2016-10 2017-06 2018-02 2018-10 2019-06 2020-02 2020-10 2021-06 2022-02 2022-10 2023-06 CPI PPI Intermediate Macroeconomics
In 2019, ( ): = 236.6 ( , Age 0-14) + 1173.5 ( ) = 1410.1 = 774.7 (Employed) + 36.3 (Unemployed) = 811.0 = 36.3/811.0 = 4.48% = 811.0/1173.5 = 69.1% In Sep 2019, the US labor statistics broke down as follows (millions): Labor Force = 158.3 (Employed) + 5.8 (Unemployed) = 164.1 Unemployment Rate = (5.8/164.1) x 100 = 3.5% Labor-Force Participation Rate = (164.1/259.6) x 100 = 63.1% Intermediate Macroeconomics


")


")
")


")
")
")


")

")
")


")


")
")