Impact Evaluation of Protected Areas and Biodiversity Conservation Projects
 undefined


UNDP-GEF PROTECTED
AREA IMPACT EVALUATION
INDEPENDENT EVALUATION OFFICE
19 October 2017
NEC Conference, Istanbul
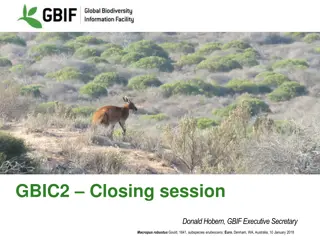
PA Impact Evaluation
State of the art science and methodology:
•
Portfolio analysis of completed projects
•
Forest change -> remote sensing data
•
Species population abundance by trend analysis before and after support
•
Human interaction with PAs using case studies from field visits
•
Trends in capacity and governance in PAs & PA systems
•
Management Effectiveness Tracking Tool Analysis
IEO
Portfolio Analysis
•
Total of 618 projects (137 countries) included in the portfolio as having
interventions in non-marine PAs and PA systems from 1992 to the present
–
More than half completed or implemented for at least 6 years
–
68% (415) full size and 32% (191) medium size
•
Implementing agencies: UNDP (48%), World Bank (37%), UNEP (9%), and
other UN agencies and regional development banks (5%)
GEF Grant
Cofinancing
US$ 2.57 B
US$ 9.70 B
TOTAL FUNDING* > US$ 12.3 B
*excludes 140 projects for which no financial data was available
Global Analysis
•
838 confirmed GEF-supported PAs in WDPA database
•
Another 27,995 Non-GEF PAs used to estimate counterfactual
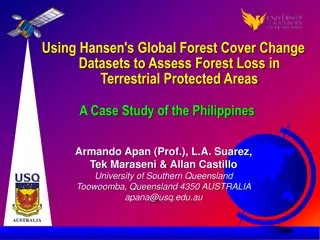
Forest Cover Change Analysis
%
Decadal Forest Cover, Gain and Loss (2000 – 2012)
C
u
m
b
r
e
s
d
e
M
o
n
t
e
r
r
e
y
,
M
E
X
I
C
O
Wildlife Abundance Change Analysis
•
A time series showing a
clear change in population
trend of Tana River Red
Colobus
after the GEF
project started in Tana
Reserve, Kenya
•
Red dashed line shows start
of GEF support, blue lines
show population trend
•
GEF project objective
consistent with observed
outcome
Before / After GEF intervention
Species:
Cercocebus galeritus
(Tana River Red Colobus)
Red List Category & Criteria: Endangered C2a(ii) ver 3.1
Species richness study
I
s
G
E
F
s
u
p
p
o
r
t
i
n
g
a
r
e
a
s
o
f
h
i
g
h
b
i
o
d
i
v
e
r
s
i
t
y
?
Pimm, SL et. al (2014)
Science
344 (6187): 1246752
Species-rich areas in Mexico vs. PA
locations
Management Effectiveness Tracking Tool (METT)
•
2440 METTs from 1924 GEF
supported PAs
•
Covering 107 countries
•
275 PAs with time series data
M
E
T
T
s
a
n
a
l
y
z
e
d
f
o
r
:
•
Compliance and completeness
•
Scores and quality of assessments
•
Overall difference between GEF and
non-GEF assessments
MEXICO
COLOMBIA
UGANDA
NAMIBIA
INDONESIA
VIETNAM
KENYA
CASE STUDY ANALYSIS
3
R
E
G
I
O
N
S
◊
7
C
O
U
N
T
R
I
E
S
◊
2
8
P
A
s
10
Qualitative Comparative
Analysis (QCA)
Cases: 28 PAs
Outcome: DECREASE IN TRENDS IN
ILLEGAL ACTIVITIES
Cases: 7 countries
Outcome: FUNCTIONAL PA SYSTEM
Findings assed which
combinations of factors are
most important for producing
observed outcomes:
biodiversity
management effectiveness
community engagement
Uses set theory rather than
probabilistic methods
Limitations & Remedies
11
Results / conclusions
When GEF links long term
engagement, financial sustainability,
and the use of multiple approaches,
stakeholders and scales, greater
adaptability and higher likelihood of
broader adoption follows.
GEF support has helped build
capacities to manage protected
areas
GEF has helped to lower habitat loss, however loss of
global biodiversity continues at an alarming rate!
This evaluation focuses on the impact of UNDP-GEF supported Protected Areas (PAs) across 137 countries since 1992. It includes analysis of forest change, species population, human interaction with PAs, capacity trends, and governance. The portfolio analysis covers 618 projects with over $12.3 billion in funding, with a key emphasis on PAs' management effectiveness. The evaluation also examines global analysis of GEF-supported PAs, forest cover change, and wildlife abundance change, showcasing tangible outcomes of GEF interventions.

Download Presentation

Please find below an Image/Link to download the presentation.
The content on the website is provided AS IS for your information and personal use only. It may not be sold, licensed, or shared on other websites without obtaining consent from the author. Download presentation by click this link. If you encounter any issues during the download, it is possible that the publisher has removed the file from their server.
E N D
Presentation Transcript
EVALUATION NEC Conference, Istanbul UNDP-GEF PROTECTED AREA IMPACT EVALUATION INDEPENDENT EVALUATION OFFICE 19 October 2017
PA Impact Evaluation State of the art science and methodology: Portfolio analysis of completed projects Forest change -> remote sensing data Species population abundance by trend analysis before and after support Human interaction with PAs using case studies from field visits Trends in capacity and governance in PAs & PA systems Management Effectiveness Tracking Tool Analysis IEO
Portfolio Analysis Total of 618 projects (137 countries) included in the portfolio as having interventions in non-marine PAs and PA systems from 1992 to the present More than half completed or implemented for at least 6 years 68% (415) full size and 32% (191) medium size Implementing agencies: UNDP (48%), World Bank (37%), UNEP (9%), and other UN agencies and regional development banks (5%) GEF Grant US$ 2.57 B Cofinancing US$ 9.70 B Latin America & the Caribbean Europe & Central Asia Africa Asia Global TOTAL FUNDING* > US$ 12.3 B *excludes 140 projects for which no financial data was available
Global Analysis 838 confirmed GEF-supported PAs in WDPA database Another 27,995 Non-GEF PAs used to estimate counterfactual
Forest Cover Change Analysis Percent Tree Cover (2000) PA 25km(excluding the inner) PA 10km PA Percent Tree Cover (%) Cumbres de Monterrey, MEXICO Yearly Percent of Forest Loss (2000 2012) Decadal Forest Cover, Gain and Loss (2000 2012) 1 80 PA PA-10km PA-25km 0.9 PA PA-10km PA-25km 70 0.8 60 Percent Forest Loss (%) 0.7 50 0.6 0.5 40 0.4 30 % 0.3 20 0.2 10 0.1 0 0 %Forest (2000) %Gain (2000- 2012) %Loss (2000- 2012) 1 2 3 4 5 6 7 8 9 10 11 12 Year (1:2000-2001, , 12: 2011-2012)
Wildlife Abundance Change Analysis Before / After GEF intervention A time series showing a clear change in population trend of Tana River Red Colobus after the GEF project started in Tana Reserve, Kenya Red dashed line shows start of GEF support, blue lines show population trend GEF project objective consistent with observed outcome Species: Cercocebus galeritus (Tana River Red Colobus) Red List Category & Criteria: Endangered C2a(ii) ver 3.1
Species richness study Mexico: Threatened Mammals richness Is GEF supporting areas of high biodiversity? Species-rich areas in Mexico vs. PA locations Pimm, SL et. al (2014) Science 344 (6187): 1246752
Management Effectiveness Tracking Tool (METT) 2440 METTs from 1924 GEF supported PAs Covering 107 countries 275 PAs with time series data Global Distribution of METT Forms METTs analyzed for: Compliance and completeness Scores and quality of assessments Overall difference between GEF and non-GEF assessments
CASE STUDY ANALYSIS MEXICO VIETNAM COLOMBIA INDONESIA UGANDA KENYA NAMIBIA 3 REGIONS 7 COUNTRIES 28 PAs
Qualitative Comparative Analysis (QCA) Cases: 7 countries Outcome: FUNCTIONAL PA SYSTEM Cases: 28 PAs Outcome: DECREASE IN TRENDS IN ILLEGAL ACTIVITIES Findings assed which combinations of factors are most important for producing observed outcomes: biodiversity management effectiveness community engagement Uses set theory rather than probabilistic methods 10
Limitations & Remedies Mixed methods approach and latest analytical methods Data scarcity gaps & inconsistencies Mismatch institutional, stakeholder, and scientific criteria High cost, high tech demand Sampling bias - non-random, uneven spatial distribution Use of big data, and best available global datasets Widely varying contexts 11
Results / conclusions When GEF links long term engagement, financial sustainability, and the use of multiple approaches, stakeholders and scales, greater adaptability and higher likelihood of broader adoption follows. GEF support has helped build capacities to manage protected areas GEF has helped to lower habitat loss, however loss of global biodiversity continues at an alarming rate!