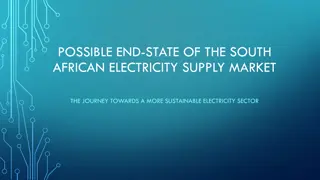
Enhancing Rail System Efficiency for Economic Sustainability in South Africa
This study by Fana Marutla explores the factors influencing efficiencies in integrated railway systems in South Africa, aiming to draw conclusions on their impact. Research objectives include understanding efficiency drivers, assessing line capacity utilization, and measuring indicators. The context emphasizes the importance of rail networks for economic growth, both nationally and regionally, highlighting opportunities for global trade facilitation. Recommendations focus on maintaining the current model while outsourcing transaction advisory and establishing partnerships for sustainable development.
- Rail System Efficiency
- Economic Sustainability
- South Africa
- Integrated Railway Systems
- Efficiency Drivers

Download Presentation

Please find below an Image/Link to download the presentation.
The content on the website is provided AS IS for your information and personal use only. It may not be sold, licensed, or shared on other websites without obtaining consent from the author. Download presentation by click this link. If you encounter any issues during the download, it is possible that the publisher has removed the file from their server.
E N D
Presentation Transcript
Principal Factors Contributing To Efficiencies And Economic Sustainability Of Integrated Railway Systems In South Africa Fana Marutla MBL, MSc & BSc (Civil Eng), Pr Eng. PhD Candidate (Rail Transportation, UP) Supervisors: Prof. H. Gr be Dr D. van der Meulen
Content/Discussion Items 1. Research objectives 2. Context of the study area 3. Line capacity utilization assessment 4. Efficiency frontier curves and Turnaround Time 5. Primary indicators being measured 6. Contribution to the industry 7. Conclusions 2
Setting the scene We want a South Africa that has prioritized its rail networks and is producing high-speed trains connecting our megacities and the remotest areas of our country (President Ramaphosa, SONA June 2019) We have 21st century technologies being managed with 20th century thinking by 19th century institutions . (World Economic Forum Guest Speaker, Ms Cheryl Martin, IHHA 2017 conference) 3
Research objectives To understand the drivers of efficiencies and inefficiencies in the integrated railway system in South Africa. Option 1: Maintain Current Model but outsource Transaction Advisory and establish a Co-fund with other partners using Sweat Equity and At time risk pledges To develop a model for measuring efficiencies and inefficiencies in the integrated railway system. To draw general conclusions about drivers of efficiencies in the integrated rail system and their impact on the economy in South Africa 4 4
Context National context Gauteng industrial and mining area remains regional production and consumption hub despite distance from nearest ports Transnet s key role is to assist in economic growth through providing appropriate, cost-effective and efficient port, rail and pipeline infrastructure and operations Continued emphasis on alignment with New Growth Path, management of carbon footprint, private-sector participation, and job creation Global context SA s distance from international markets results in high maritime transport costs SA well placed to service Southern African and most BRICS shipping trade routes Opportunity to position SA as global transshipment hub focusing on selected trade routes Regional context SA well positioned to serve African east and west coasts by sea SA s rail network provides strategic and common-gauge connectivity to neighbouring SADC countries Regional partnerships will stimulate and sustain regional growth National and regional strategies are being developed to facilitate trade throughout the globe, and transport infrastructure should be planned accordingly. Source: Transnet LTPF 5
Line Capacity Utilization Assessment Operational Capacity is the capacity in the form of train slots that are usable for trains carrying freight to pass through the system. The operational capacity is then determined by subtracting the required maintenance slots and operational allowances The only additional allowances should be due to external or inherent design issues Where better information is not readily available, the guideline is to assume that operational capacity is 65% of theoretical capacity. To calculate Practical capacity, these lost slots need to be subtracted Once the Z-slots reaches the Y-slots level (ideal condition), additional infrastructure interventions are needed. Upgrades can increase the installed capacity if these are upgrades. 100 Maintenance and Operational allowance (35%) X / Z = Practical Capacity utilization (%) 65 Condition-based allowance < 60% : Light utilisation Available Capacity Theoretical Capacity (100%) 60 80% : Moderate utilisation Operational Capacity (65%) (Y - slots) 80 95% : Heavy utilisation Practical Capacity (Z - slots) Used Capacity (X - slots) 95 105% : Utilisation limit 105 130% : Over-utilisation >130% : System failure 0 Source: Transnet 6
Efficiency Frontier curves 20t/a 17% IRR 15% Above the line: Allocative Inefficiency (Operator benefit at the expense of the mine owner) Tariff (Cents/net ton-km) B C A D Below the line: Production (Mine owner benefit) Technical Efficiency: more volume moved at a reduced tariff compared to position A. Mtpa T1 T2 7
Comparison of TAT, Variable Capex, Throughput and other operating inputs TAT Trains per day State influenced by capacity 50% 8 9 10 75% 100% (50hrs) Train Speed Variable Capex 80kph 60kph No. of wagons, locos, loops, etc 16mtpa 15 % 70 % 20mtpa IRR 80 % Efficiency of running trains 12.5 % 10 % 90% Desired tonnage Level 8
Primary indicators being measured 30 year Port, Rail, Road and Pipeline forecasts Tariff IRR TAT Capex Sus. Capex Opex 9
Comparison of Tariff efficiency for different axle loading The understanding of the transition points are part of the study Tariff (US cents/ net ton-km) 20t/a 26t/a 30t/a 3.5 2 75 Mtpa 20 10
Heavy haul lines in South Africa Coal line Iron-Ore line Sishen Ermelo Khumani Oorkruis Halfweg Commissionerspan Vryheid Knersvlakte Salkor Richards Bay Saldanha Ermelo Richards Bay 200 Millions Sishen Saldanha 150 120 Millions 100 100 80 50 60 40 - 20 2014 2018 2023 2028 2033 2038 2044 0 2014 2018 2023 2028 2033 2038 2044 11
Efficiency, Reliability & Availability Relative efficiency and productivity are a function of environmental variables and are correlated with punctuality and safety (Affuso et al, 2002) o companies operating long distance routes might for instance enjoy economies of scale relative to companies operating in low customer density regions. Efficiency is the comparison of what is actually produced or performed with what can be achieved with the same consumption of resources (money,time,labour,equipment,etc) (Business Dictionary) Productivity is a specific measure of the efficiency of production related to the input needed to produce the desired output (e.g. train- km/net ton-km) Network Reliability is the share of planned trains not affected by infrastructure related incidents Network Availability isthe share of total network units (in hour kilometers) not affected by planned occupations 12
RAMS and Efficiency Efficiency=?????? (?.?. ????????? ??) ????? (????? ??) ??????????? + ?????????????? = ???????????? + ?????? Performance=?????? ??????????? ?????? 13
Productivity of wagons as an indicator of efficiency Traffic Density comparison (traffic units/km of track) Wagon Productivity in various regions of Africa (Africa = 100%) 14 Source: SSATP, March 2013
Options for capacity creation Reduce throughput time Equalise demand and scheduling Improve terminal processes Improve track maintenance planning Improve rolling stock reliability Improve average speed (limited) Run more trains Upgrade train control systems Improve electrification system Add trackside monitoring equipment Improve asset security systems Increased volumes Run heavier trains Install higher axle load track Upgrade structures Match traction type 25kVA Increase electrical supply Flatten gradients and ease curves Run longer trains Increase length of passing loops Reconfigure terminal infrastructure Increase electrical supply Improve traction force distribution Improve braking systems Supporting technologies Standardisation Operational planning Integrated system approach Train configuration Traction type Axle load ECP/DP Train control Electrification Wagon types System redundancy Consolidated bulk loading terminals Long-term Planning Framework Reliability of rail sub systems Terminals, rail and port systems sustainability 15 Source: Transnet
STATE OF THE CONSTRUCTION INDUSTRY Current Financial Performance And Causes Source: http://www.cesa.co.za/sites/default/files/20190306_CESA%20Indaba_David%20Metelerkamp_Infrastru cture%20Investment_0.pdf Source: Industry Insight 2019 16
STATE OF THE CONSTRUCTION INDUSTRY Current Financial Performance And Causes In 2009, net profit for all construction companies was around R7bn, this had dropped to R1bn in 2015 and increased to R2.9bn by 2016. Source: PWC Analysis 17
INDUSTRY PROSPECTS - GOVERMENT EXPENDITURE Use of Proceeds, Prospects and Forecast Step in the right direction. Notwithstanding the lack of speed in delivering infrastructure projects, Government will continue to spend on infrastructure. Source: Industry Insight 2019 18
INDUSTRY PROSPECTS SA MINING CAPEX Use of Proceeds, Prospects and Forecast Mining Capital Expenditure expected to increase from 2019 for most SA Mining Majors The Mining Charter expected to be finalised in 2019 and will trigger investment in the industry Source: Annual Reports 2018 19
Contribution to the industry The results of this research work will contribute to the understanding of efficiencies and inefficiencies in the integrated rail system and associated impact on economic development in South Africa. The area of research identified in this study is aligned with National Rail Policy (White Paper) objectives and the findings and recommendations of the research work will contribute towards the attainment of the objectives of the National Rail Policy in South Africa. South Africa, being the largest rail operator in Africa, is used for benchmarking purposes by other African railway markets. This study will play a pivotal role towards contributing to the body of knowledge in this industry. 20
Conclusions Option 1: Maintain Current Model but outsource Transaction Advisory and establish a Co-fund with other partners using Sweat Equity and At time risk pledges The gathering of data is gaining momentum as more and more clarity is sought of the study direction and the methodology being used. Conclusions The support received from Transnet and GMA has been encouraging and motivating. With South Africa facing developmental challenges it is necessary to deal with all economic input parameters in order to develop a holistic solution. The study area will contribute to the envisaged prosperous future of South Africa. 21
Infra Availability and Reliability Resulting in lost volume 100% = Total network 14.90 m Hrs kms Availability is the share of total network units (in hour kilometers) not affected by planned occupations = 0.74 m Hrs kms 4.9% Planned occupations = 0.14 m Hrs kms 1% Cancelled occupations = 0.06 m Hrs kms 0.4% Occupation overruns = 0.07 m Hrs kms 0.6% Speed restrictions = 14.03 m Hrs kms 94% Availability 13,487 trains = 100% Executed trains* Reliability is the share of planned trains not affected by infrastructure related incidents 306 trains = 2% OHTE related incidents 3% Signaling related incidents 368 trains = 0% Perway related incidents 57 trains = 95% Reliability 12,757 trains = Source: Team analysis, NatCor 1 incident report, occupation report * Actual executed trains plus trains lost due to infra incidents Jan Dec 2006, NatCor1 23
The Number Of Monthly Infrastructure Related Incidents Is Variable And Not Consistently Correlated To Actual Volumes NatCor 1, FY06/07 Perway (# incidents) Signaling (# incidents) OHTE (# incidents) Actuals 06 07 (volumes) Reliability (%) NatCor 1 trains run 100 700000 Number of incidents / Average daily trains on 90 600000 80 No direct and consistent correlation was found between number of incidents and actual volumes and trains run. 500000 70 Natcor 1 / per cent Volume units 60 400000 50 300000 40 30 200000 20 100000 10 0 0 Apr- 06 May- 06 Jun- 06 Jul- 06 Aug- 06 Sep- 06 Oct- 06 Nov- 06 Dec- 06 Jan- 07 Feb- 07 Mar- 07 24 Source: NatCor duty manager incident report; CPP; team analysis
Both Single And Double Line Occupations Are Required To Conduct Certain Maintenance Work Estimated workload (%) Impact on operations Types of maintenance Set replacements Maintenance on section insulators Sub-station maintenance General crossover maintenance ~6% Double line On-track machines e.g. screening, tamping etc.* Maintenance of turnouts Geometrical Alignment of track Repair wheel spin burn marks Clean cuttings and drains with drain cleaner OHTE permit maintenance Rail welding ~64% Single line (Regular or shutdown) Level crossing maintenance Mainline turnout maintenance Sleeper and fastening replacement Repair wheel spin burn marks OHTE live maintenance ~30% On track / between trains Bridge, culvert and cutting maintenance Drainage maintenance and repairs Fire breaks, tree felling and vegetation control Maintenance of fences and roads * Machine working forms the core of single line shutdowns Source: Infra reengineering team Varying Off track 25
Demand forecasting: Market share example Example Rail Ideal Rail threshold Small parcels Volume Big parcels Rail addressable market (RAM) Distance travelled The model segments the O-D pairs once the distance and parcel size parameters are set and the distance distribution and parcel size representation illustrated is developed. From this the road friendly, competing, and rail friendly volumes are determined and the volumes forecasted.
Interoperability Operational Guiding > 250 km/h < 30 km/h Speed < 17 t Interoperability opportunity: South African passenger and freight trains typically operate in different speed, axle load, curve and gradient zones For light freight such as containers, a zone of co-existence with passenger trains are being investigated on the non-heavy haul network lines (120 160 km/h zone) Co-existence of freight and passengers in the true high-speed zone (+200 km/h), or high axle loads (>20t/a), is not desirable Proposals for interoperability included in LTPF Metro Metro LDP Bearing Target Zone: Interoperability Transnet GFB Transnet > 26t Heavy Haul Axle Load 27
The Case for Railway Capacity comparison: passenger per 3.5m lane per hour 28