Advanced Investment Analysis: Financials Sector Overview and Recommendations
The Advanced Investment Analysis provides insights into the Financials sector, recommending an underweight position due to potential recession signals. Current holdings include diversified banks and credit services companies, with a suggestion to adjust the fund weight and reallocate investments to hedge against macroeconomic risks. Detailed market data on key stocks like BAC and AXP is also presented, along with target prices and performance evaluations.
Download Presentation

Please find below an Image/Link to download the presentation.
The content on the website is provided AS IS for your information and personal use only. It may not be sold, licensed, or shared on other websites without obtaining consent from the author. Download presentation by click this link. If you encounter any issues during the download, it is possible that the publisher has removed the file from their server.
E N D
Presentation Transcript
Financials Sector BUSFIN 4228/7225: Advanced Investment Analysis Royce West Ben Raines, Josue Rendon, Joel Pickering, Jack Spellacy
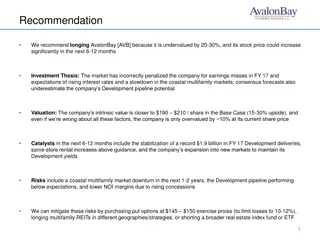
Recommendation Recap We recommend the Financials sector be underweight relative to its weighting in the S&P 500 Index in the Student Investment Management (SIM) portfolio. There are many signals that the economy could enter a recession, and we recommend that the SIM portfolio assume a defensive position in the financials sector. Consumer confidence: Index falls to lowest level since Feb 2021 Interest rates: Fed continuously raising rates in response to inflation New car sales: Lowest level year-to-date Stock market: S&P 500 Index down 16% since peak in Jan 2022 GDP growth: Real GDP decreased 1.6% in 22:Q1 Credit card debt and late payments: Increase from 21:Q1 to 22:Q1 Inflation: Annual rate is 9.1% as of May 2022
Current Holdings The SIM portfolio currently holds four stocks representing 10.8% of the portfolio's value, exactly in line with the SP500's sector weight as of 6/30. We hold two diversified banks and two credit services companies. Financial stocks are very inexpensive currently due to their recessionary risk.
Suggested Holdings We recommend adjusting the weight of the fund down from 10.80% to 10.00% to hedge against the financial sector's significant exposure to macro economic risk. American Express has the least upside of our current portfolio and is trading close to our target price for the equity and we recommend selling our stake in the company With the proceeds, purchase additional shares of Discover and JPM, both of which have significant upside, and purchase a stake in Citi.
Overview Overview Market Data Ticker BAC Market Cap 248.47B Founded as the Bank of Italy in San Francisco in in the early 1900s One of the largest banks in the world, significant market share in credit issuance, deposits, wealth management. Consumer Banking Global Wealth and Investing Management Global Markets Global Banking Shares Outstanding (M) 8.55B and debit card 52 Week Range $30.40 - $50.11 Earnings Per Share $3.51 Current Price $33.05 Target Price $40.84 Fund Cost Basis $29.68
Overview Market Data Ticker AXP Global payment and travel company Charge and credit payment card products and travel- related services One of the world's largest travel service providers Global Consumer Services Group, Global Commerical Services, Global Merchant and Network Services Current price is nearing consensus target price of $166 Economic indicators positive for AXP outlook - high reliance on credit lending, low unemployment, demand for housing SELL (HOLD) recommendation use cash to purchase additional shares of DFS and JPM, and assume stake in C Market Cap 118.31 B Shares Outstanding 790 M 52 Week Range $134.12 - $199.55 Earnings Per Share $9.78 Current Price $149.76 Fund Cost Basis $124.17
Overview Overview Market Data Ticker DFS Discover Financial Services started as a Sears subsidiary in 1985, under the name of Dean Witter Financial Services Group, Inc. Market Cap 27.64B Shares Outstanding (B) 300,000 Merged with Morgan Stanley to become Morgan Stanley Dean Witter, Discover & Co in 1997. Later to spin-off in 2007 52 Week Range 88.02-135.69 Earnings Per Share 15.42 Discovers acquisitions have led the business to run several major components in the banking and financing industry, breaking the business into two segments. Discover's Direct Digital Banking Payment Service; PULSE, Diners Club, and Discover's Network Current Price $98.36 Dividend Yield 2.40% Target Price $135.33
Fundamental Drivers Fundamental Drivers Consumer Spending: In great economical time, the public tends to spend more on goods and services, increasing the amount of money spent and the amount of loans taken out. Discover payment service, Diner's Club, and network partners, rely heavily on travel-and-entertainment spending outside of the United States. As of today, moving further into a post-pandemic era, Travel and Entertainment are seeing some of the highest record numbers not seen in years. Global Expansion: Discover has made efforts to expand its business and boost its network volume outside the United State. Over the past years, Discover has partnered with several global networks, issuers, and payment organizations that dominate in their region expanding the Discover network to all four corners, opening the acceptance of millions of international cardholders. Its focus to grow in sales volume and in new account growth. In January 2022, Discover made a deal with The National Bank of Serbia to boost the global acceptance for the Discover Global Network. Partnered with JCB (Japan), BC (South Korea), UnionPay (China), Troy (Turkey), Verve (Nigeria), Prosa (Mexico).
Financial Analysis & Valuation Financial Analysis & Valuation Absolute Valuation *As of May 30, 2022* Current Stock Price Current Multiple Your Target Multiple Target/ Current Target Price P/E $103 6.16X 8 1.2987 $135.06 P/B $103 2.37 3 1.2658 $131.64 P/S $103 2.24 3 1.3393 $139.29 Average $135.33
Discounted Cash Flow Model Discounted Cash Flow Model Terminal Discount Rate: 11.0% Terminal FCF Growth: 3% Current Price: $98.36 Implied Price: $135.44 Implied Upside: 37.7%
Recommendation Recommendation DCF Price Multiple Price Current Price $135.44 $135.33 $98.36 According to the DCF Price Target of $135.44 there is a 37.7% upside from the current price of $98.36 According to the Multiple Price Target of $135.33 there is a 37.6% upside from the current price of $98.36 We recommend a BUY of DFS to increase the sector allocation from 14% to 22.34%.
Overview Overview Market Data Ticker JPM The Manhattan Company, JPMorgan Chase's earliest predecessor institution, was founded in 1799 Drexel, Morgan & Co. is founded in 1871 Chase Bank began business in 1877 J.P. Morgan merges with Chase Manhattan in 2000 Largest bank in the United States with $2.87 Trillion in total assets Operates in four business segments: Consumer & Community Banking Corporate & Investment Bank Commercial Banking Asset & Wealth Management Market Cap 341.81B Shares Outstanding (B) 3,027 52 Week Range 111.48 - 172.96 Earnings Per Share 13.48 Current Price $115.32 Dividend Yield 3.54% YTD Return -24.35% History of Our Firm
Macro Environment & Drivers Macro Environment & Drivers Consumer Spending: Several indicators of consumer spending on services suggest continued strength. These include the daily number of people passing through airport security checkpoints, weekly ticket sales at movie theatres, and the weekly hotel occupancy rate. These signs of consumer spending strength can mean continued consumer spending which is great for the financial sector. Housing Market: The critically important housing industry is now showing signs of stress, likely due, in part, to the tightening of monetary policy that has boosted the average mortgage interest rate significantly. Housing inventory has increased sharply in recent weeks, evidently due to declining demand. Showing of homes for sale are down, and housing starts fell sharply in May. As the housing market sees stress, the financial sector can see residual stress as consumers will be more hesitant to take out loans from banks to purchase housing. Rising Interest Rates: The Federal Reserve raised the target range of the Federal Funds rate by 75 basis points on June 15, the largest hike since 1994. The decision was nearly unanimous with one Fed policymaker voting to raise the rate of 50 basis points. The Fed attributed its decision to the high rate of inflation and noted that the war in Ukraine has exacerbated that problem. In response, equity prices initially increased while bond yields fell. Investors evidently saw this action as boosting the likelihood of a soft landing. This will not be the last time that the Fed makes news. It is likely that there will be further significant increases in the Fed Funds rate in the months to come. Rapidly increasing rates could cause havoc not just for JPMorgan Chase & Co., but on the entire financial sector.
Financial Analysis & Valuation Financial Analysis & Valuation Absolute Valuation *As of May 23, 2022* Current Stock Price Current Multiple Your Target Multiple Target/ Current Target Price P/E $122.45 9.24 12 1.30 $159.19 P/B $122.45 1.28 1 0.78 $95.51 P/S $122.45 2.98 3 1.01 $123.67 Average $126.12
Discounted Cash Flow Model Discounted Cash Flow Model Terminal Discount Rate: 11.0% Terminal FCF Growth: 3.0% Current Price: $115.32 Implied Price: $145.70 Implied Upside: 26.3%
Recommendation Recommendation DCF Price Multiple Price Current Price $145.70 $126.12 $115.32 According to the DCF Price Target of $145.70 there is a 26.3% upside from the current price of $115.32 According to the Multiple Price Target of $126.12 there is a 9.37% upside from the current price of $115.32 We recommend a BUY of JPM to increase the sector allocation from 14% to 22.34%.
Citigroup Citigroup Market Data Ticker C Market Cap 99.08B Founded in June 1812 Fourth largest bank in the United States with $2.39 Trillion in total assets Operates in two business segments: Global Consumer Banking (GCB) Institutional Clients Group (ICG) Shares Outstanding (M) 1,937 52 Week Range 43.44 - 74.64 Earnings Per Share 6.67 Current Price $51.70 Dividend Yield 3.91% YTD Return -22.21%
Macro Environment & Drivers Macro Environment & Drivers Increased Interest Rates Increased Inflation Consumer & Client Behavior Uncertainties related to COVID-19 Citigroup 1 Year-to-Date Performance
Financial Analysis & Valuation Financial Analysis & Valuation Absolute Valuation *As of May 23, 2022* Current Stock Price Current Multiple Your Target/ Current Target Price Target Multiple P/E $51.70 6.50 10 1.54 $79.62 P/B $51.70 0.56 1 1.79 $92.54 P/S $51.70 1.40 2 1.43 $73.93 Average $82.03
Discounted Cash Flow Model Discounted Cash Flow Model Terminal Discount Rate: 12.0% Terminal FCF Growth: 3.0% Current Price: $51.50 Implied Price: $82.73 Implied Upside: 60.0%
Recommendation Recommendation DCF Price Multiple Price Current Price $82.73 $82.03 $51.70 According to the DCF Price Target of $82.73 there is a 60.0% upside from the current price of $51.70 According to the Multiple Price Target of $82.03 there is a 58.67% upside from the current price of $51.70 We recommend a BUY of Citigroup to increase the sector allocation from 0% to 22.34%.
Conclusion Conclusion Stock Current Price Current Weighting Recommendation Future Weighting Target Price Expected Return AXP $149.76 4.28% Sell (Hold) 0.00% - 4.28% $166.00 10.84% BAC $33.05 3.48% Hold 3.48% $40.84 23.57% DFS $98.36 1.50% Buy 1.50% $135.44 37.77% JPM $113.42 1.55% Buy 1.55% $145.70 28.46% C $51.70 0.00% Buy 3.47% $82.73 60.02% BAC DFS JPM C AXP significant market share in credit and debit card issuance, dep osits, wealth management Healthy credit and customer tech adoption Drivers include consumer spending and global expansion 25-35% upside according to multiples and DCF Drivers include consumer spending, demand for housing, and rising interest rates 9-26% upside according to multiples and DCF Fourth largest bank in US 58-60% upside according to multiples and DCF Current price nearing consensus target price High reliance on credit lending Current economic indicators interest rates, unemployment, demand for housing
