Funding Regional Infrastructure: Local Income Tax Increment Allocation
This presentation outlines a strategy to fund regional infrastructure through a Local Income Tax Increment Allocation concept. It discusses commuting patterns, vehicle miles traveled distribution, infrastructure funding sources, and four-year capital funding projections in Central Indiana counties.
- Regional Infrastructure
- Income Tax Allocation
- Commuting Patterns
- Vehicle Miles Traveled
- Capital Funding

Download Presentation

Please find below an Image/Link to download the presentation.
The content on the website is provided AS IS for your information and personal use only. It may not be sold, licensed, or shared on other websites without obtaining consent from the author. Download presentation by click this link. If you encounter any issues during the download, it is possible that the publisher has removed the file from their server.
E N D
Presentation Transcript
Strategy to Fund Regional Infrastructure Local Income Tax Increment Allocation Concept
REGIONAL COMMUTING PATTERNS MADISON In total, 161,500 workers (23%) who work in Marion County every day commute from surrounding counties. HAMILTON BOONE 6,000 to Marion 900 to Madison 55,000 to Marion 15,000 to Hamilton 11,000 to Marion 2,900 to Boone Wages taxed via the local income tax, are taxed by the county of residence. HANCOCK HENDRICKS Source: IT-40 data compiled by the Indiana Business Research Center 15,000 to Marion 2,900 to Hancock 33,000 to Marion 10,00 to Hendricks MARION 4,000 to Marion 900 to Shelby 27,000 to Marion 7,000 to Johnson 11,000 to Marion 1,200 to Morgan JOHNSON SHELBY MORGAN 2
VEHICLE MILES TRAVELED Distribution of Vehicle Miles Traveled among Central Indiana Counties (2016) Includes Non-Interstate Freeway, Major Arterial, Minor Arterial Roads Vehicle miles traveled (VMT) data is published by INDOT for all counties. Marion 48% Hamilton 17% VMT is a proxy for the use of infrastructure and the costs required to sustain the transportation network. Johnson 7% Hendricks 7% Madison 6% Only non-interstate freeways, principal arterials and minor arterials (major thoroughfares) are included because of their role in intra- regional transportation. Morgan 6% Hancock 4% Boone 3% Shelby 2% 0% 25% 50% Source: INDOT 3
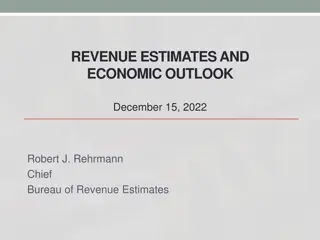
INFRASTRUCTURE FUNDING Annual Indianapolis Infrastructure Funding by Source $400 Includes revenues dedicated to: DPW Transportation Improvement Program Transportation Maintenance and Operations Transportation Engineering $300 $ Millions $200 $100 $ 2009 2010 2011 2012 2013 2014 2015 2016 2017 2018 2019 Est 2020 Est 2021 Est 2022 Est 2023 Est Taxes Special Income Tax Distribution Bonds Other Revenues Rebuild Indy TIF Target ($160 M) Source: Indianapolis Office of Finance and Management 4
FOUR YEAR CAPITAL FUNDING PROJECTIONS DPW Capital Program 2019 2020 2021 2022 2023 TOTAL Funding S o urc e s LRS Construction Neighborhoods $ 5,000,000 $ 5,000,000 $ 5,000,000 $ 5,000,000 $ 5,000,000 $ 25,000,000 MVH Construction Neighborhoods $ 5,000,000 $ 5,000,000 $ 5,000,000 $ 5,000,000 $ 5,000,000 $ 25,000,000 New Funding | HB 1002 $ 10,000,000 $ 7,500,000 $ 4,250,000 $ 3,500,000 $ 3,500,000 $ 28,750,000 Gas Tax Funding $ 20,000,000 $ 17,500,000 $ 14,250,000 $ 13,500,000 $ 13,500,000 $ 78,750,000 City Cumulative - Transportation $ 560,000 $ 560,000 $ - $ - $ - $ 1,120,000 County Cum - Streets $ 4,240,000 $ 4,240,000 $ - $ - $ - $ 8,480,000 P arking Capital $ 3,700,000 $ 6,000,000 $ 4,000,000 $ 4,000,000 $ 4,000,000 $ 21,700,000 New Bonds ($120M ) $ 30,000,000 $ 50,000,000 $ 40,000,000 $ - $ - $ 120,000,000 New Funding | COIT Money $ 17,000,000 $ 5,000,000 $ 8,000,000 $ - $ - $ 30,000,000 BRT Money $ - $ 500,000 $ 1,000,000 $ 1,000,000 $ 1,000,000 $ 3,500,000 Othe r Lo c al Funds $ 55,500,000 $ 66,300,000 $ 53,000,000 $ 5,000,000 $ 5,000,000 $ 184,800,000 Community Crossings Grant $ 1,933,359 $ 1,000,000 $ 1,000,000 $ 1,000,000 $ 1,000,000 $ 5,933,359 Multi Modal $ - $ 1,000,000 $ 1,000,000 $ 1,000,000 $ 1,000,000 $ 4,000,000 LP A Federal Aid $ 17,326,658 $ 33,570,199 $ 21,986,897 $ 13,630,000 $ 19,070,659 $ 105,584,413 Indianapolis Neighborhood Infrastruture P rogram (INIP ) $ 3,259,607 $ 4,000,000 $ 4,000,000 $ 4,000,000 $ - $ 15,259,607 Tax Increment Financing $ 12,200,000 $ 5,000,000 $ 9,240,000 $ 9,240,000 $ 9,240,000 $ 44,920,000 P P P /Grant/Donation $ 1,335,729 $ 40,000 $ 4,900,000 $ - $ - $ 6,275,729 Exte rnal Funds $ 36,055,352 $ 44,610,199 $ 42,126,897 $ 28,870,000 $ 30,310,659 $ 181,973,107 Funding S o urc e s To tal $ 111,555,352 $ 128,410,199 $ 109,376,897 $ 47,370,000 $ 48,810,659 $ 445,523,107 5
CIRCUIT BREAKER IMPACT Property Tax Revenue Net Levy and Circuit Breaker $450 $4 $400 $57 $55 $53 $350 $52 $47 $39 $14 $48 $44 $300 $26 $ Millions $250 $200 $343 $330 $150 $324 $318 $331 $304 $315 $292 $296 $397 $278 $100 $50 $0 2008 2009 2010 2011 2012 2013 2014* 2015 2016 2017 2018 Budget Estimated Net Levy Circuit Breaker *2014 includes $19 million in one-time property tax revenue due to Homestead 6
CURRENT INCOME TAX DISTRIBUTION Comparison of Wages Earned vs. Income Taxes Collected in the 9-County Region 100.0% 90.0% 80.0% Wages Earned in the County Approximately $130 million in taxes from Marion County wages are distributed outside the County 70.0% 66.4% Income Taxes Collected by the County 60.0% 50.0% 39.4% 40.0% 30.0% 27.0% 20.0% 14.6% 8.2% 7.5% 10.0% 5.4% 4.9% 4.2% 3.9% 3.7% 3.0% 2.9% 2.3% 2.0% 1.6% 1.5% 1.3% 0.0% Boone Hamilton Hancock Hendricks Johnson Madison Marion Morgan Shelby Source: Wages: Woods and Poole estimate of wages earned Collections: Indiana State Budget Agency; normalized to an equal tax rate 7
LOCAL INCOME TAX RATES Local Income Tax Rates in Central Indiana Local income tax rates range from 1.00% in Hamilton and Johnson Counties to 2.72% in Morgan County. 3.00% Property Tax Relief Special Purpose Economic Development 2.50% Public Safety Marion County s current income tax rate is 2.02% Certified Shares - Spending 2.00% In some counties, a portion of the income tax rate is dedicated to special uses, such as public transit, jails, or property tax relief [sometimes via bonding]. 1.50% 1.00% Each county in the 9- county region already imposes an Expenditure Rate for spendable income tax revenue of at least 1.00%. 0.50% 0.00% Marion Morgan Shelby Boone Hendricks Hancock Madison Hamilton Johnson 8
POLICY FACTORS 1. Transportation infrastructure is a critical component to the growth of a regional economy. 2. The cost burden of critical infrastructure is shared unevenly across the region. 3. Vehicle miles travelled (VMT) or alternative metrics demonstrate the usage of infrastructure assets between and among Central Indiana residents. 4. A basic policy premise is: the users of infrastructure assets should bear the costs in relation to their usage. 9
FRAMEWORK A TIF-Like Income Tax Concept 120 A portion of the incremental increase will be allocated to the Regional Infrastructure Fund 100 Regional Income Tax Base (Billions) 80 Historical Regional Tax Base Growth 60 Base Established in first year 40 20 - 10
FRAMEWORK Illustrative Incremental Set Aside How much to Allocate? 120 Portion Allocated to Regional Infrastructure 100 Regional Income Tax Base (Billions) 80 Historical Tax Base Growth 60 Portion of increment distributed in normal fashion to Counties Base Established in first year 40 20 - 11
CAPITAL FINANCING MARION COUNTY SEPARATED Approximate Annual Bonding Capacity Bond Proceeds 20 Year Term; 3.5% Rate (dollars in millions) 250 Surrounding County Bond Proceeds Marion County Bond Proceeds 118 200 109 Potential annual bond proceeds 102 Bonding Capacity ($MIllions) 94 88 150 83 81 77 72 67 60 100 101 93 87 80 75 70 69 66 61 50 57 51 - 2021 2022 2023 2024 2025 2026 2027 2028 2029 2030 2031 12
INFRASTRUCTURE FUNDING Annual Indianapolis Transportation Funding with Regional Infrastructure Proceeds $400 $300 $ Millions $200 $100 $ 2009 2010 2011 2012 2013 2014 2015 2016 2017 2018 2019 Est 2020 Est 2021 Est 2022 Est 2023 Est 2024 Est 2025 Est 2026 Est 2027 Est 2028 Est 2029 Est 2030 Est Infrastructure Spending Regional Funding Bond Proceeds Target ($160 M) 13
VMT BASED ALLOCATION Funding Contribution from Income Tax vs. VMT Based Distribution 3% Boone 7% 18% Hamilton 33% 5% Hancock 4% 6% Hendricks 9% 6% Johnson 9% 7% Madison 3% 46% Marion 32% 6% Morgan 2% 3% 1% Shelby 0% 5% 10% 15% 20% 25% 30% 35% 40% 45% 50% Distribution Contribution 14


![Town of [Town Name] Real Estate Tax Rates and FY 2024 Budget Summary](/thumb/62211/town-of-town-name-real-estate-tax-rates-and-fy-2024-budget-summary.jpg)