Analysis of Plant Populations Effects in Various Regions of Iowa
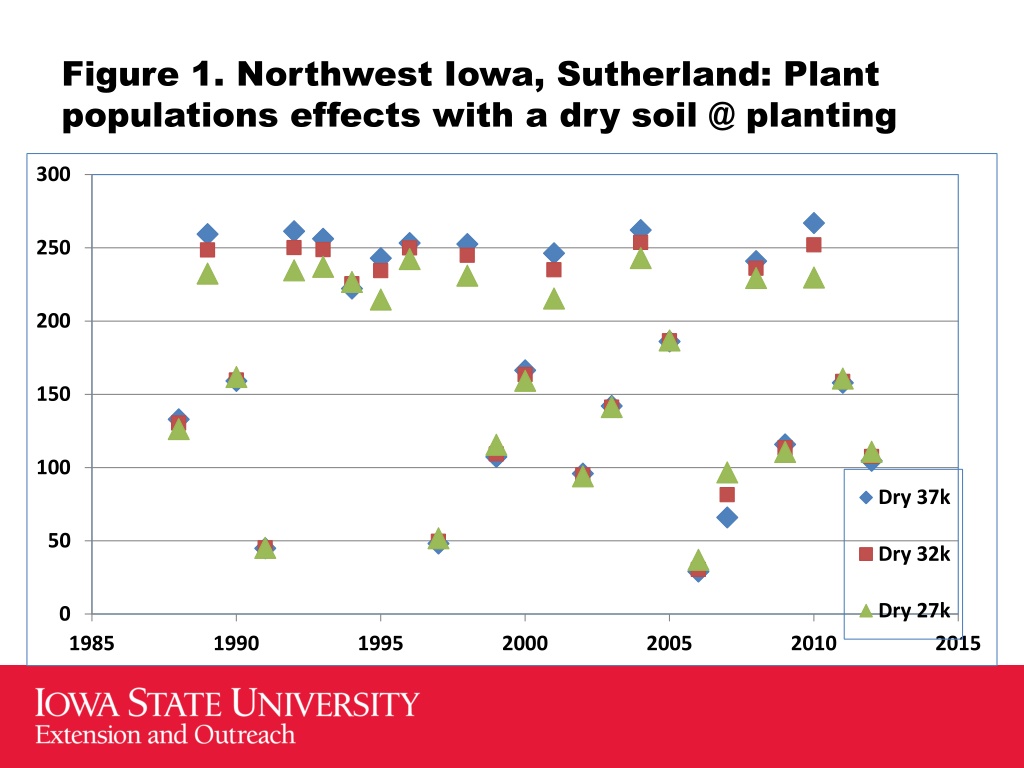
The figures depict the impact of plant populations on yield in different regions of Iowa under dry soil conditions. The data spans several years, showing trends in plant populations and corresponding yields over time. Each figure focuses on a specific region, providing insights into agricultural practices and productivity in Iowa.

Download Presentation

Please find below an Image/Link to download the presentation.
The content on the website is provided AS IS for your information and personal use only. It may not be sold, licensed, or shared on other websites without obtaining consent from the author. Download presentation by click this link. If you encounter any issues during the download, it is possible that the publisher has removed the file from their server.
E N D
Presentation Transcript
Figure 1. Northwest Iowa, Sutherland: Plant populations effects with a dry soil @ planting 300 250 200 150 100 Dry 37k 50 Dry 32k Dry 27k 0 1985 1990 1995 2000 2005 2010 2015
Figure 2. Northern Iowa, Kanawha: Plant populations effects with a dry soil @ planting 300 250 200 Yield (bu/acre) Dry 37k Dry 32k 150 Dry 27k 100 50 0 1996 1998 2000 2002 2004 2006 2008 2010 2012 2014
Figure 3. Northeast Iowa, Nashua: Plant populations effects with a dry soil @ planting 350 300 250 Yield (bu/acre) Dry 37k 200 Dry 32k 150 Dry 27k 100 50 0 1985 1990 1995 2000 2005 2010 2015
Figure 4. West Central Iowa, Castana: Plant populations effects with a dry soil @ planting 300 Dry 37k 250 Dry 32k Dry 27k 200 Yield (bu/acre) 150 100 50 0 1985 1990 1995 2000 2005 2010 2015
Figure 5. Central Iowa, Ames: Plant populations effects with a dry soil @ planting 300 250 200 Yield (bu/acre) 150 100 Dry 37k Dry 32k 50 Dry 27k 0 1980 1985 1990 1995 2000 2005 2010 2015
Figure 6. SW Iowa, Lewis: Plant populations effects with a dry soil @ planting 350 300 250 Yield (bu/acre) Dry 37k 200 Dry 32k 150 Dry 27k 100 50 0 1996 1998 2000 2002 2004 2006 2008 2010 2012 2014
Figure 7. SE Iowa, Crawfordsville: Plant populations effects with a dry soil @ planting 350 300 250 Yield (bu/acre) 200 Dry 37k Dry 32k 150 Dry 27k 100 50 0 1985 1990 1995 2000 2005 2010 2015
Figure 8. Corn Plant Populations 32 Plant Population (plants per acre x 1000) 30 IL 28 IN IA 26 Iowa = 0.3976x - 768.99 R = 0.985 MN 24 NE IR NE Dry 22 OH 20 WI 18 Linear (IA) 16 2000 2002 2004 2006 2008 2010 2012 Compiled from USDA-NASS data