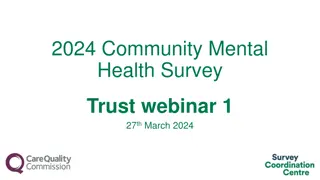
National Child Outcomes Results for 2016-17 Webinar Overview
Shift from compliance to results in child services emphasizing positive social-emotional skills, knowledge acquisition, and appropriate behaviors. Structured around three child outcomes and state approaches for measuring outcomes. Discusses summary statements and method for calculating national estimates.

Download Presentation

Please find below an Image/Link to download the presentation.
The content on the website is provided AS IS for your information and personal use only. It may not be sold, licensed, or shared on other websites without obtaining consent from the author. Download presentation by click this link. If you encounter any issues during the download, it is possible that the publisher has removed the file from their server.
E N D
Presentation Transcript
IDEA Part C and Part B Section 619 National Child Outcomes Results for 2016-17 Webinar October 9, 2018 Presenters: Christina Kasprzak and Cornelia Taylor
Webinar Intended Outcomes Learn about the latest national child outcomes data and patterns Identify where to find more information about the national analysis and resources to support state and local child outcomes data use Poll questions about your role and familiarity with child outcomes requirements 2
General Background The emphasis has shifted from getting children access to services (compliance) to focusing on results. All federal agencies are required to report on the outcomes achieved by their programs. The Office of Special Education Programs (OSEP) uses child outcomes data to: Justify the funding for Part C and Part B Preschool. Monitor state results through Results Driven Accountability processes (Part C only). 3
Three Child Outcomes In 2005, OSEP required states to report data on 3 child outcomes. Children have positive social emotional skills (including social relationships) Children acquire and use knowledge and skills (including early language/ communication [and early literacy]) Children use appropriate behaviors to meet their needs 4
The Summary Statements 1. Of those children who entered or exited the program below age expectations in each outcome, the percent who substantially increased their rate of growth by program exit. 2. The percent of children who were functioning within age expectations in each outcome by program exit. 6
State Approaches to Measuring Child Outcomes: FFY 2016-17 Part C (N=56) 42 (75%) Part B/619 (N=59) 41 (69%) (decrease -2) 10 (17%) (increase +2) 6 (10%) Approach COS 8 (14%) One tool statewide 3 (5%) Publisher's online system 3 (5%) 2 (3%) Other TOTAL 56 59 7
Method for Calculating National Estimates & Criteria Weighted average of states that met minimum quality criteria Minimum quality criteria for inclusion in national analysis: Reporting data on enough children Part C 28% or more of exiters Part B Preschool 12% or more of child count Within expected patterns in the data category a not greater than 10% category e not greater than 65% 8
Number of States that Met Criteria for Inclusion in the National Analysis (out of 51 possible) 46 43 19 15 08-09 09-10 10-11 11-12 Part C 12-13 Part B Preschool 13-14 14-15 15-16 16-17 9
Table 1. Reasons for excluding Part C states Table 2. Reasons for excluding Part B 619 states Reason # excluded Reason # excluded Sampling 3 Sampling 2 Missing data (Reported outcomes data on less than 12% of child count) 1 Missing data (Reported outcomes data on less than 28% of exiters) 1 "a" and "e" patterning (Had at least one outcome with category "a" greater than 10% or category "e" greater than 65%) 2 "a" and "e" patterning (Had at least one outcome with category "a" greater than 10% or category "e" greater than 65%) 2 No 3-5 Child Count data available for 2016-2017 2 States included in the analysis 43 States included in the analysis 46 10
National Child Outcomes Data for Children Exiting in 2016-17 Part C Early Intervention Part B Preschool Summary Statement 1 Summary Statement 2 Summary Statement 1 Summary Statement 2 Outcome Social Relationships 67 58 80 60 Knowledge and Skills Action to Meet Needs 73 49 81 56 75 57 80 65 Note: Data are based on 46 Part C states and 43 Part B Preschool states. Only states with high-quality data were included. 11
Part C: Completeness* of Child Outcomes Data (n=50) National Average 65% (Increase of 2% since FFY15) 96% 5% * Completeness = total with outcomes data/total exiters 12
Part B Preschool: Completeness* of Child Outcomes Data (n=49) 68% National Average 31% (Decrease of 3% since FFY15) 1% * Completeness = (total with outcomes data/child count) 13
Part C State Variation: Exited within Age Expectations Knowledge and Skills, 2016-17 (n=51) 74% National Estimate 49% 17% 17
Part B State Variation: Exited within Age Expectations Knowledge and Skills, 2016-2017 (n= 51) 78% National Estimate 56% 8% 18
Part C: Average Percentage Who Exited within Age Expectations by State Percent Served*, 2016-17 (n=51) 63% 61% 57% 56% 54% 53% 53% 47% 44% Social Relationships Knowledge & Skills 2.5-3.9% (n=24) Action to Meet Needs < 2.5% (n=14) > 3.9% (n=12) * Link to Percent Served Data 19
Part B Preschool: Average Percentage Who Exited within Age Expectations by State 3-5 Percent Served*, 2016-17 (N=49) 70% 66% 63% 60% 60% 56% 55% 52% 51% Social Relationships Knowledge & Skills 5.7-7.5% (n=15) Action to Meet Needs < 5.7% (n=15) >7.5% (n=19) 20 *Link to Percent Served Data
2016-17 State Data Quality Profiles Poll questions about your receipt and use of the state data profiles 23
Other Child Outcomes Resources Child Outcomes Highlights for FFY16 A 2-page summary of the national results. Special Collection of Outcomes Reports An online collection of child outcomes data reports that states have produced for their local programs. Year-to-Year Changes in State Child Outcomes Data: What Do They Mean? A 4-page brief designed to help stakeholders learn what questions to ask to understand year- to-year changes in child outcomes data. Child Outcomes Summary (COS) Process Professional Development Resources Collection of national resources to support training and TA on the COS process. 24
Find out more at ectacenter.org and dasycenter.org The ECTA Center is a program of the FPG Child Development Institute of the University of North Carolina at Chapel Hill, funded through cooperative agreement number H326P170001 from the Office of Special Education Programs, U.S. Department of Education. Opinions expressed herein do not necessarily represent the Department of Education's position or policy. Project Officers: Julia Martin-Eile The DaSy Center is a program of SRI International, funded through cooperative agreement number H326P120002 from the Office of Special Education Programs, U.S. Department of Education. Opinions expressed herein do not necessarily represent the Department of Education's position or policy. Project Officers: Meredith Miceli & Richelle Davis 25