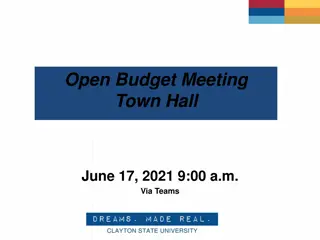
Promoting Student Success at Clayton State University
The role of the president in driving student success at any institution is crucial. This involves actively supporting students, staff, and institutional efforts, as well as addressing challenges and embracing a culture of progress. Data on institutional characteristics, such as average age, full-time status, non-traditional undergraduate students, and off-campus work, provides insights into the student body. Understanding these factors is essential for designing effective strategies and plans to enhance graduation rates and overall campus priorities.
Download Presentation

Please find below an Image/Link to download the presentation.
The content on the website is provided AS IS for your information and personal use only. It may not be sold, licensed, or shared on other websites without obtaining consent from the author. Download presentation by click this link. If you encounter any issues during the download, it is possible that the publisher has removed the file from their server.
E N D
Presentation Transcript
Introduction Clayton State University 2010 "The central conservative truth is that it is culture, not politics, that determines the success of a society. The central liberal truth is that politics can change a culture and save it from itself." Daniel Patrick Moynahan The role of the president in promoting student success at any college or university cannot be overstated. The president should be the daily face of student success, should be cheerleading institutional efforts, walking the talk with respect to visibly helping students in difficulty, and rewarding staff who make real contributions in this area. (AASCU, 2005)
Outline of Discussion Institutional Characteristics Roots of the Problem Evidence of Current Activities successes and unsuccesses Metrics and reasoning for choice of metrics Three Year Plan and links of plan to identified Challenges Graduation as Campus Priority
Institutional Characteristics NOT a statement that we are unusual/special and thus cannot make significant improvements IS a statement that progress must account for those characteristics we can identify through data about our potential and actual students and graduates
Average Age Semester Clayton State State Universities Fall 2009 28.7 24.3 Fall 2008 28.4 24.2 Fall 2007 28.1 24.3 Fall 2006 27.9 24.5
Full-Time Status Semester Clayton State State Universities Fall 2009 57.0% 72.6% Fall 2008 55.9% 71.1% Fall 2007 55.4% 70.2% Fall 2006 55.4% 68.7%
Non-traditional Undergraduate Students Semester Clayton State State Universities Fall 2009 39.1% 16.8% Fall 2008 37.7% 16.4% Fall 2007 36.6% 16.9% Fall 2006 36.5% 17.5%
Work for pay off campus (First-Year Students) Fall 2009 Fall 2008 Fall 2007 Fall 2006 Hrs/wk Clayton State Selected Peers Clayton State Selected Peers Clayton State Selected Peers Clayton State Selected Peers 0 41% 66% 29% 55% 28% 64% 18% 46% 1-5 4% 5% 1% 4% 4% 4% 1% 5% 6-10 5% 5% 4% 5% 4% 5% 1% 6% 11-15 4% 6% 5% 6% 5% 5% 3% 7% 16-20 7% 6% 9% 7% 6% 6% 4% 8% 21-25 11% 4% 11% 7% 10% 5% 6% 6% 26-30 4% 2% 7% 4% 8% 3% 5% 5% 30+ 23% 6% 33% 12% 34% 8% 62% 17%
Provide Care for Dependents Fall 2009 Fall 2008 Fall 2007 Fall 2006 Hrs/wk Clayton State Selected Peers Clayton State Selected Peers Clayton State Selected Peers Clayton State Selected Peers 0 42% 71% 37% 65% 36% 72% 27% 53% 1-5 17% 13% 16% 14% 19% 12% 13% 16% 6-10 9% 5% 11% 7% 12% 5% 8% 8% 11-15 5% 3% 7% 4% 5% 3% 5% 4% 16-20 4% 2% 3% 2% 4% 2% 9% 4% 21-25 1% 1% 2% 1% 3% 1% 6% 2% 26-30 3% 1% 4% 1% 2% 0% 1% 1% 30+ 18% 4% 21% 7% 18% 5% 31% 12%
Inferences from Characteristics of current students Activities must account for students who are older, non-traditional, likely to have families and work obligations, and are 15% less likely to be full time than students at other peer institutions Remain optimistic as degree programs better adapt to current demands, and support programs have expanded to better support our students
Current First Time Full Time Retention
Dimensions of current challenges Inconsistencies in current student preparation College is an unfamiliar environment for many of our students 1/3 to 2/3 of students come from families without college graduates 40% Fall 2009 undergraduates non- traditional
Dimensions of Challenge, Continued Students need support for choosing a major matching abilities, available time, and potential career choices/opportunities (highest reported need by 2009 cohort was career advice, followed by time management; financial advice was in top 5) Some recent improvements for students for available time for school (23% Fall 2009 work more than 30 hours (vs. 6% of peers); 33% in 2008 Greatest predictor (CSU Fall 2008 data) of year one retention was number of hours worked
Dimensions of Challenge, Continued Students choose difficult majors, and are not retained in majors Pre-Nursing 693 Pre-Business 678 Biology 412 Evidence supports needs to improve career advising/course advising Also supports need for intensive support in difficult entry courses
Preparation and first time success Selected Courses with D/F/W Rates > 40% from the Fall of 2009 Course Title Number earning D/F/W 32 of students % of students earning D/F/W 40% ACCT 2102 Principles of Financial Accounting Principle of Biology BIOL 1108 23 42.6% CHEM 1151 Survey of Chemistry 126 52.9% CHEM 1152 Survey of Chemistry II 60 46.5% CHEM 1211 Principles Chemistry I Principles Chemistry II Introduction to Mathematical Modeling Survey of Calculus of 63 60.6% CHEM 1212 of 29 50.9% MATH 1101 50 42.7% MATH 1241 49 52.1% PHYS 1111 Introductory Physics 24 53.3%
Challenges to Student Learning Habits and Skills Nine of top ten feeder schools from Clayton County (tenth in Henry County did not make AYP) 32% of schools in Clayton County unable to make AYP (2009) 18% state wide Many students come to us without significant expectations for institutional success
Challenges to Student Success Even with improvements for Fall, 2009, 11% in poor academic standing 2007 institutional data indicates 75% students with 2.0 GPA retained to second year
Retention by GPA BY GPA Not Retained Retained Total % Retained Less than 1.99 60 15 75 20.0% 2.0 to 2.499 17 43 60 71.7% 2.50 to 2.999 19 80 99 80.8% 3.0 or above 28 111 139 79.9% 124 249 373 66.8%
Challenges in institutional readiness Better need to improve advising and course selection activities to match student needs Better need to develop clearer career advising and career connections Greater need to systematically increase faculty/student interactions especially for upper classmen-even with perceived support currently
NSSE Data 2009 Southeast Public 52.4 56.1 * Carnegie Class NSSE 2009 Level of Academic Challenge Active and Collaborative Learning Student- Faculty interaction Enriching educational experience Supportive Campus Environment First-Year Senior Year 53.5 57.8 53.0 57.7 53.7 57.0 First-Year Senior Year 44.5 53.2 43.0 51.1 * 44.9 53.8 43.2 51.0** First-Year Senior Year 35.1 43.6 35.5 42.9 37.4 * 46.2 ** 34.7 42.0 First-Year Senior Year 27.2 38.4 28.1 40.0 27.1 40.9** 28.0 40.8 ** First-Year Senior Year 64.5 65.3 61.1 ** 58.0 *** 63.5 61.6 *** 61.6 * 58.2 ***
Challenges, continued Historic lack of integration among strong efforts/historic lack of collaboration across divisions Room for improvement in creation of new campus wide culture of collaboration challenge is not commitment of community, but shared strategies to fulfill the commitment
Challenges, continued Need to improve access to science lab facilities Fall, 2008, 125 student waiting list for biology labs some relief with 3 additional labs available Spring 2011 Without new science building, limits to growth of key programs in nursing, science secondary education limited
Successes and Barriers to Success Progress in graduation rates/retention rates as noted earlier, the institution has recently made improvements (see slide) Progress has roots in many initiatives aimed at improving student success Learning communities First year experience program requirements Center for academic success (serves 40% of undergraduates currently
Institution 2008-2009 2004-2005 % Inc/dec 04-05 to 08-09 Albany State University 520 546 -5% Armstrong Atlantic State University 898 657 37% Augusta State University 608 529 15% Clayton State University 871 558 56% Columbus State University 850 651 31% Fort Valley State University 242 229 6% Georgia College & State University 979 771 27% Georgia Southwestern State University 385 334 15% Kennesaw State University 3,019 1,908 58% North Georgia College & State University 769 669 15% Savannah State University 326 286 14% Southern Polytechnic State University 519 433 20% University of West Georgia 1,335 1,136 18% TOTAL 11,321 8,707 30%
Success and Barriers to Success Mandatory Advising after mid term grades/mandatory reporting of mid term grades Additional baccalaureate academic programs significantly support improved graduation rates examples of psychology and biology examples follow
Biology Bachelor's Degrees 50 45 Number of Majors . 40 35 30 25 20 15 10 5 0 FY 98 FY 99 FY 00 FY 01 FY 02 FY 03 FY 04 FY 05 FY 06 FY 07 FY 08 FY 09 Term
Psychology Bachelor's Degrees 120 Number of Majors . 100 80 60 40 20 0 FY 98 FY 99 FY 00 FY 01 FY 02 FY 03 FY 04 FY 05 FY 06 FY 07 FY 08 FY 09 Term
Less than successful program attempts Summer bridge program aimed at less prepared students, and provides summer head starts to date unsuccessful because of habits of late decisions by students to seek admission. Faculty Mentor program successful insofar as many faculty expressed interest in participating few students academically challenged expressed interest
Program in process Child care potentially affects many students Business plans for campus child care historically challenging interest; uneven demand; child care as variable costs to individuals and not fixed costs; high costs for low income students Current actions education of local options; initial discussions with potential off campus partners
Metrics for three year goals 70% first to second year retention rates 40% (50% system) six year graduation rates (aspiration at 50% and 60%)(Montclair State example) 10% (minimum) improvements in success rates in current high D-W-F courses Improvements in perceived performances in first year experience program Time management skills Financial management Study and learning strategies Information seeking skills
Highest % Lowest % Current % Two-Year Public BA/BS Public MA/MS Public PhD Public 53.7( 08, 09) 70.0( 04) 71.6( 06) 78.1( 04) 51.3( 04) 53.7 67.6 69.8 74.4 66.4( 96, 05) 68.1( 89) 72.9( 08) Two-year Private 72.6( 92) 55.5( 08) 55.5 BA/BS Private 74.0( 89) 69.6( 08) 69.9 MA/MS Private 78.0( 85) 72.3( 08) 72.0 PhD Private 85.0( 85) 80.4( 08) 80.6 32
Highest % Lowest % Current % BA/BS Public MA/MS Public PhD Public 52.8( 86) 46.7( 86) 50.6( 89, 90) 45.0( 01) 39.6( 06) 37.0( 00) 43.0 38.4 48.7 BA/BS Private 57.5( 06) 53.3( 01) 55.9 MA/MS Private 58.4( 88) 53.5( 01) 54.8 PhD Private NATIONAL 68.8( 86) 54.6( 90) 63.1(05) 65.1 52.6 50.9( 01) 33
Metrics for success Greater assessment of individual engagement activities (ex: campus organizations and activities; ex: disaggregated learning communities Development of, and publication of, clearly reported dashboard indicators. ex: retention by major; ex: common definitions of advisement and charting of frequencies
Necessity for Plans If you don't know where you are going, you might wind up someplace else. Yogi Berra
Three Year Plan Must Address Previously considered elements Leadership Shared Campus Responsibility Coordination of Campus Efforts Clearer Dashboard Indicators to assess effectiveness Negotiating Financial support for Students
Plan Year One Retention and graduation improvements to be integrated in current planning efforts Strategic planning Facilities master planning Strategic enrollment management (recruitment, public school student development through graduation from Clayton State) Messaging and communication
Plan Year One Newly developed Executive Level Enrollment management committee, jointly directed by Provost and Vice President for Student Affairs Currently recruiting Associate Vice President for Enrollment Management and Student Success Creation of pre-made schedules for first year students, to increase chances of success Refine current graduation review processes for incremental improvements in graduation rates (90+ hours assessed, and graduation plan advised) preview for possible year two and three development of graduation coaches. Commit the institution to successful improvement of graduation and retention rates with public presidential leadership and leadership actions ex, teaching first year students and promising need for success
Plan Year Two Associate Vice President charged with oversight of coordinated and collaborative strategies for retention, progression and graduation rates Review must include review of success rates for native (from first time full time cohorts) and transfer students, reviewing means to increase graduation success for both groups Review and integrate current and evolving FYE operations
Plan Year Two Coordinate multi-faceted activities outlined in text Must include Completion of dashboard indicators, link of advising to career skills and career connections Must include connections with emerging residential experiences Must include increasingly institutionalized partnerships with K-12 partners, especially Clayton, Henry and Fayette County schools Develop plans and programs to expand financial support for students Target available faculty and staff hiring guided by goal of maximizing student successes Identify ombuds to assist students in avoiding roadblocks to success examples of printer in residence hall and referral to counseling services
Plan Year Three Three major elements Actions based on assessment data from first and second year activities Assess relationships between improvements and resources Modify activities aimed at first and second year students to achieve improvements for third and fourth year students Further assess ability to assist students financially
Graduation as a Campus Priority Selling this to the campus is not a hard sell!! Selling collaboration and shared responsibility will be focus of cultural changes some evidence of progress already beginning Presidential and leadership engagement is already a given clarity of targets will be next steps


