Albuquerque Rapid Transit Ridership Report February 2023
In the monthly informational report for February 2023, ridership on regular fixed routes of Albuquerque Rapid Transit was detailed along with paratransit (Sun Van) ridership and customer service calls. The report shows fluctuations in ridership numbers and call handling percentages over several months. Notably, there was a 3.39% increase in Paratransit/Sun Van ridership from January 2023 and a 29.34% increase from February 2022.

Download Presentation

Please find below an Image/Link to download the presentation.
The content on the website is provided AS IS for your information and personal use only. It may not be sold, licensed, or shared on other websites without obtaining consent from the author. Download presentation by click this link. If you encounter any issues during the download, it is possible that the publisher has removed the file from their server.
E N D
Presentation Transcript
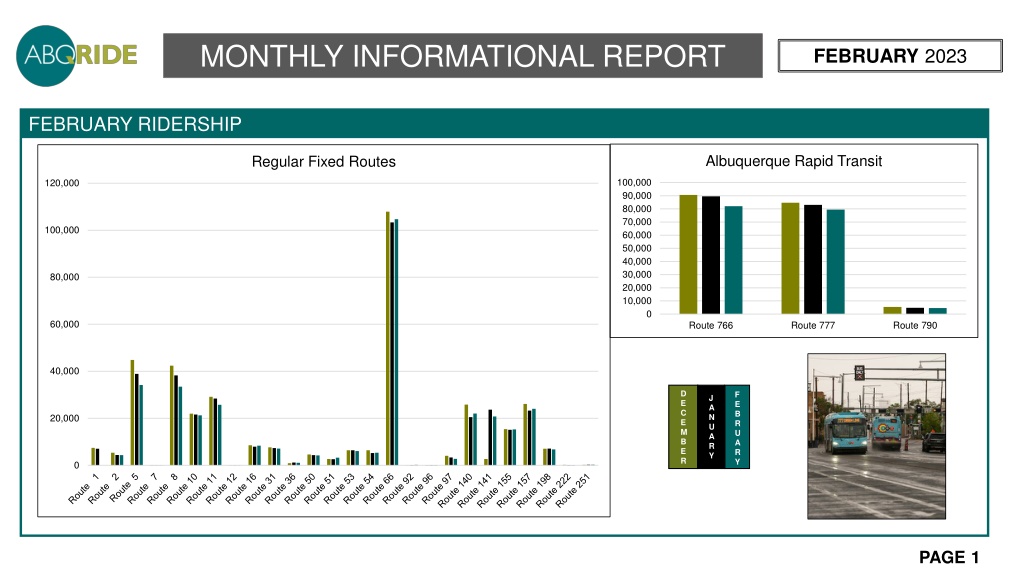
MONTHLY INFORMATIONAL REPORT FEBRUARY 2023 FEBRUARY RIDERSHIP Albuquerque Rapid Transit Regular Fixed Routes 100,000 120,000 90,000 80,000 70,000 100,000 60,000 50,000 40,000 30,000 80,000 20,000 10,000 0 60,000 Route 766 Route 777 Route 790 40,000 D E C E M B E R F E B R U A R Y J A N U A R Y 20,000 0 PAGE 1
RIDERSHIP Fixed Route Ridership FY20 Month JUL FY19 FY21 FY22 FY23 781,280 880,079 795,408 837,665 758,173 670,554 716,045 755,491 805,880 770,017 815,378 694,714 746,344 729,005 370,222 333,389 349,035 378,371 295,324 276,468 275,283 393,282 395,706 389,426 438,310 418,177 387,785 422,724 525,529 589,100 508,877 563,424 540,232 579,365 547,662 AUG SEP OCT NOV DEC JAN 698,976 757,396 779,357 755,731 729,045 764,293 630,292 315,901 306,544 336,563 275,242 356,489 356,158 345,151 365,471 401,963 469,247 458,194 462,601 477,309 523,320 FEB MAR APR MAY JUN Total 9,159,709 7,670,422 3,976,603 5,114,724 4,377,509 4.4% decrease from January, 2023 30.2% increase from February, 2022 MONTHLY INFORMATIONAL REPORT | FEBRURY 2023 PAGE 2
PARATRANSIT/SUN VAN 3.39% increase from January 2023 29.34% increase from February 2022 Paratransit (Sun Van) Ridership FY19 FY20 20,659 20,732 23,534 22,168 21,363 21,228 24,424 23,554 21,388 19,867 19,004 19,496 22,085 21,475 20,686 20,618 21,993 12,795 22,936 3,809 20,937 4,296 19,741 6,348 258,750 196,386 Month Jul Aug Sep Oct Nov Dec Jan Feb Mar Apr May Jun Total FY21 6,786 7,031 7,127 7,479 5,800 6,094 6,331 6,179 8,165 9,589 9,519 10,215 90,315 FY22 10,901 12,623 13,165 14,007 12,727 12,097 12,064 11,874 14,412 14,395 14,267 13,756 156,288 FY23 13,623 16,343 15,423 15,611 13,002 14,208 14,855 15,359 Sun Van Applications FY20 76 91 82 88 72 84 64 75 42 7 20 30 731 Month Jul Aug Sep Oct Nov Dec Jan Feb Mar Apr May Jun Total FY19 78 91 67 90 63 66 70 91 83 94 112 89 994 FY21 18 22 26 32 25 19 20 29 34 47 37 67 376 FY22 37 86 67 58 39 44 37 50 44 37 93 64 656 FY23 59 50 105 95 104 32 52 40 120,371 Sun Van Ridership 577 6,000 7,000 8,000 9,000 10,000 11,000 12,000 13,000 14,000 15,000 16,000 MONTHLY INFORMATIONAL REPORT | FEBRUARY 2023 PAGE 3
CUSTOMER SERVICE Total Customer Service Calls 20,000 18,000 D E C E M B E R F E B R U A R Y 16,000 J A N U A R Y 14,000 12,000 10,000 8,000 6,000 4,000 2,000 0 Plan Your Ride Sun Van Reservations Total Calls Month Calls Presented Calls Presented Calls Presented Calls Handled % Calls Handled % Calls Handled % 87.7 82.02 70.92 81.03 86.88 89.56 92.21 88.64 2,043 2,112 2,268 1,856 1,449 1,627 1,783 1,875 1,477 1,229 911 1,029 946 1,231 1,423 1,381 72.3 58.19 40.17 55.44 65.29 75.66 79.81 73.65 13,712 16,288 16,795 15,653 13,108 13,985 16,680 15,870 12,340 13,864 12,609 13,160 11,701 12,752 15,603 14,349 89.99 85.12 75.08 84.07 89.27 91.18 93.54 90.42 15,755 18,400 19,063 17,509 14,557 15,612 18,463 17,745 13,817 15,093 13,520 14,189 12,647 13,983 17,026 15,730 JUL AUG SEP OCT NOV DEC JAN FEB MONTHLY INFORMATIONAL REPORT | FEBRUARY 2023 PAGE 4
SECURITY Security Calls vs. Security Checks 800 700 600 500 400 300 200 100 0 Jul Aug Sep Oct Nov Dec Jan Feb Total Security Calls Security Check Total Security Calls 260 245 247 271 294 354 473 398 Security Check Month *Security Checks include officers conducting proactive/routine checks of Transit facilities (bus stops, transit centers) to ensure these areas remain safe. Jul Aug Sep Oct Nov Dec Jan Feb 466 432 444 483 544 597 703 621 MONTHLY INFORMATIONAL REPORT | FEBRUARY 2023 PAGE 5
SECURITY CALLS BY LOCATION Calls on Bus Routes Route 766/777 February January December Route 157 Route 155 Route 140/141 Route 66 Route 53/54 Route 50 Calls To Transit Centers Route 31 Tramway/Wenonah Route 16 Daytona Route 11 Yale Route 10 UTC Route 8 NWTC Route 5 MTC Route 2 CUTC Route 1 ATC 0 20 40 60 80 100 120 140 0 50 100 150 200 250 300 350 400 450 500 MONTHLY INFORMATIONAL REPORT | FEBRUARY 2023 PAGE 6
SECURITY CALLS BY LOCATION Figure S1 FY23 JUL AUG SEP OCT NOV DEC JAN FEB ATC 235 332 274 273 420 441 46 136 CUTC 76 72 57 78 81 121 35 33 MTC 15 1 2 2 1 0 0 0 NWTC 16 4 8 4 4 7 4 2 UTC 76 83 82 81 81 96 14 29 Yale 35 17 9 21 6 6 2 2 Daytona 32 14 10 14 11 16 1 0 Tramway/Wenonah 49 20 31 35 28 43 8 22 Figure S2 Route 1 0 0 0 2 0 0 1 0 Route 2 0 1 0 0 0 1 1 1 Route 5 7 1 4 8 3 7 2 0 Route 8 5 2 8 0 7 4 0 0 Route 10 6 6 6 0 3 1 4 2 Route 11 4 3 5 4 5 1 3 5 Route 16 2 0 5 4 1 0 1 1 Route 31 2 1 1 1 4 1 0 1 Route 50 0 1 0 0 0 2 0 1 Route 53/54 1 2 2 1 0 0 1 2 Route 66 31 57 80 90 80 52 108 62 Route 140/141 4 3 4 5 5 10 6 7 Route 155 0 3 4 5 3 10 11 7 Route 157 2 2 1 2 3 2 0 0 Route 766/777 52 46 77 96 100 117 86 66 FY23 JUL AUG SEP OCT NOV DEC JAN FEB MONTHLY INFORMATIONAL REPORT | FEBRUARY 2023 PAGE 7
SECURITY CALLS BY TYPE 14 12 Mental Health 1 0 0 1 1 0 0 0 Suspicious Situation 8 31 19 10 5 11 10 4 10 FY23 JUL AUG SEP OCT NOV DEC JAN FEB MAR APR MAY JUN Assault 0 1 3 0 3 3 1 1 Fight 8 7 5 9 4 3 12 9 Fire 1 0 1 3 4 3 4 7 Traffic 2 0 0 3 5 1 0 2 Trespass 3 2 7 1 2 1 2 9 Vandal 3 5 3 2 1 3 1 1 8 6 4 2 0 Assault Fight Fire Mental Health Traffic Trespass Vandal Suspicious Situation DEC JAN FEB Disorderly Conduct 40 27 29 46 40 49 61 45 Wellness/ Medical 70 45 65 50 51 64 63 64 200 Intoxicated Other Narcotics Loitering FY23 180 10 16 12 16 16 13 14 23 57 29 13 7 12 16 16 21 41 49 68 93 119 116 179 134 16 33 22 30 31 53 61 41 JUL AUG SEP OCT NOV DEC JAN FEB MAR APR MAY JUN 160 140 120 100 80 60 40 20 0 Intoxicated Other Narcotics Disorderly Conduct Loitering Wellness/ Medical MONTHLY INFORMATIONAL REPORT | FEBRUARY 2023 PAGE 8
Monthly Updates & Accomplishments Closed 49 service requests from 311 related to bus stops Installed No Trespassing signs at all ART stations Submitted RAISE Grant application for Uptown TOD Launched phase 2 of public engagement for the ABQ RIDE Forward Network Plan Engaged with approximately 612 individuals at marketing/tabling events Thanked ABQ RIDE passengers by passing out free pizza coupons for Papa Murphy s on Rider Appreciation Day Trained Dispatchers on new radio system Addressed safety concerns at route 11 bus stop near UNMH. Hired 7 new Motorcoach Operators and 3 new Sun Van Chauffeurs Completed detailed cleaning of 61 buses and 29 Sun Vans Mechanics completed 592 work orders. MONTHLY INFORMATIONAL REPORT | FEBRUARY 2023 PAGE 9