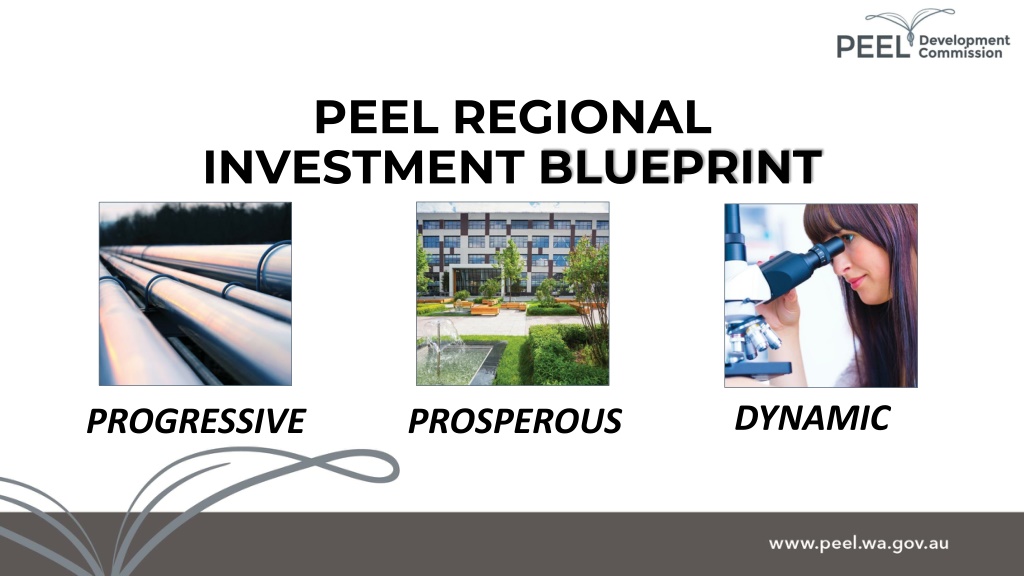
Peel Regional Investment Blueprint: Dynamic Progress Towards Prosperity
Our region, Peel, has experienced significant economic growth, with the gross regional product increasing from $3 billion in 2002-03 to $11.1 billion in 2012-13. The mining and minerals sector is the largest contributor to our economy, followed by retail and construction. The construction, manufacturing, and retail industries are major employers, and our population is rapidly increasing. By 2050, Peel is projected to become one of the most populated regions outside of Perth. To support this growth, the region must focus on building a diverse economy, fostering innovation in business, and developing a highly skilled workforce.

Uploaded on Oct 04, 2024 | 0 Views
Download Presentation

Please find below an Image/Link to download the presentation.
The content on the website is provided AS IS for your information and personal use only. It may not be sold, licensed, or shared on other websites without obtaining consent from the author. Download presentation by click this link. If you encounter any issues during the download, it is possible that the publisher has removed the file from their server.
E N D
Presentation Transcript
PEEL REGIONAL INVESTMENT BLUEPRINT DYNAMIC PROGRESSIVE PROSPEROUS
Our gross regional product has increased from $3b in 2002-03 to $11.1b in 2012/2013 12 11 11 10 10 8 8 8 Billions 6 6 5 5 4 4 3 3 3 2 0 2001-02 2002-03 2003-04 2004-05 2005-06 2006-07 2007-08 2008-09 2009-10 2010-11 2011-12 2012-13 GROSS REGIONAL PRODUCT
Mining and minerals is our largest contributor to GRP, followed by retail and construction. Mining and Mineral Processing (2012-13) $3,200 Retail Turnover (2011-12) $1,122 Building Construction (2012-13) $419 Tourism (2010-11-12) $174 Agriculture (2011-12) $125 Timber (2012-13) $6 Fishing and Aquaculture (2011-12) $6 0 500 1,000 1,500 2,000 2,500 3,000 3,500 $ million GROSS REGIONAL PRODUCT BY INDUSTRY SECTOR
The construction, manufacturing and retail industries are our biggest employers. Construction Manufacturing Retail Trade Health Care and Social Assistance Mining Education and Training Accommodation and Food Services Public Administration and Safety Professional, Scientific and Technical Services Other Services Transport, Postal and Warehousing Administrative and Support Services Wholesale Trade Inadequately described/ Not stated Agriculture, Forestry and Fishing Rental, Hiring and Real Estate Services Financial and Insurance Services Arts and Recreation Services Electricity, Gas, Water and Waste Services Information Media and Telecommunications 0.00% 2.00% 4.00% 6.00% 8.00% 10.00% 12.00% 14.00% 16.00% EMPLOYMENT BY INDUSTRY SECTOR
We have a rapidly increasing population. Peel 140000 120000 100000 80000 60000 40000 20000 0
Our fast growing population By 2050, the Peel is expected to be one of the most populated regions outside of Perth with a projected population of 310,000. To support a population of this size, the Peel needs to build an economy that incorporates many industries, adopts an innovative approach to business, and has a highly skilled and high performing workforce. EMPLOYMENT BY INDUSTRY SECTOR
Whats the purpose of the Blueprint Our Blueprint describes Peel s vision and provides a roadmap for delivering outcomes that will create jobs and generate economic growth. It focuses on transformational strategies aimed at : broadening and diversifying the region s business and commercial sectors. enhancing innovation, investment and research. creating a highly skilled, capable and available workforce. building vibrant and sustainable communities.
Our vision By 2050 we want the Peel to be recognised nationally and internationally as a progressive, prosperous and dynamic region.
And to do this we need 1. Thriving Industry 2. Agriculture and Food Innovation 3. Capable People 4. Strong and resilient communities
What does the Blueprint mean for you? The Blueprint identifies strategies linked to economic growth and jobs creation. Funding is available for projects that demonstrate alignment with the Blueprint. The funding program comprises: Community Chest Grants Regional Grant Scheme Funding for infrastructure, innovation and services will create opportunities for businesses across the region. State-wide Blueprint Initiatives Southern Investment Initiative 11
What does the Blueprint mean for you? Buy Local can be a determining funding factor in the comparative assessment of tenders. There are knock on benefits to Peel businesses from projects in the pipeline, especially construction projects such as Peel Business Park Nambeelup, the Old Mandurah Traffic Bridge Replacement, Murray Regional Equestrian Centre and Peel Integrated Water Cycling Initiative. 12
A new Business Park one of our legacy projects The establishment of a Business Park at the Nambeelup Industrial Area is a transformational project that will stimulate major business and industrial developments across the whole region over the next 15 to 20 years creating: 17,000 direct and indirect jobs which will support local employment and protect the income of local families; annual economic output of $2.3 - $2.6 billion; annual export value of $189 - $214 million; annual gross value added activity of $750 - $900 million; and increases in average weekly wages of 26 - 32% within the Park. 13
And finally The announcement yesterday of Royalties for Regions funding of $2.5 million for a sport and recreation centre in Boddington and $600,000 toward the construction of the new Byford and Districts Country Club will provide a range of opportunities for local and regional businesses (total project cost $5.68 million). Keep an eye on TendersWA, Common User Arrangements and the media to see what is in the pipeline for the Peel and how your business might benefit. And talk to us or to the proponents if you need more information. 14