Understanding Community Health Networks in Blueprint Communities
This study explores the emergence of networks in Blueprint communities to support population and individual health. It delves into the role of Community Health Teams, relationships between organizations, successful network characteristics, and impacts on health outcomes. Surveys and social network analysis provide insights into collaborative modes shaping these networks.

Download Presentation

Please find below an Image/Link to download the presentation.
The content on the website is provided AS IS for your information and personal use only. It may not be sold, licensed, or shared on other websites without obtaining consent from the author. Download presentation by click this link. If you encounter any issues during the download, it is possible that the publisher has removed the file from their server.
E N D
Presentation Transcript
Middleburys Community Health Network
Objective Objective Describe the network of organizations that has emerged in each Blueprint HSA to support population and individual health, focusing on modes of collaboration and relationships between organizations Background and Key Questions This study is the first step towards answering key questions about the networks that are active in Blueprint communities: What role did investment in core Community Health Teams have in seeding these larger networks? How are the participating organizations connected to each other? How are these relationships maintained and reinforced how durable are they? What characteristics do the most successful networks share? What impact do these networks have on individual and population health?
Who We Surveyed A Community Defined Network Starting point a core group of organizations similar to those in the area s RCPC/UCC Added organizations mentioned multiple times by core group members in pre-survey outreach
Survey Participation Invitations and reminders sent via Survey Monkey Additional reminders sent directly via email (avoiding spam filters) Invitations Sent 37 Surveys Started 25 Response Rate 68% Completed Surveys 22 Completion Rate 88%
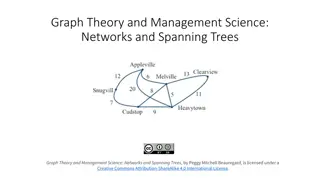
Social Network Analysis What? A network graph maps interactions Network analysis quantifies relationships Why? Describe a community objectively Explore the relationships that make up a community Look for patterns across communities Inform planning of collaboration for community health improvement
Community Network List Development Core Network Membership In this Health Service Area (HSA) network membership began with a core group of organizations similar to the organizations represented in the area s Unified Community Collaborative. Community Additions Before conducting the full survey, we reached out to representatives of the core organization via email to ask what organizations were actively involved in the network but not already on the list. Organizations mentioned multiple times were included in the full survey.
Network Maps MIDDLEBURY HEALTH SERVICE AREA
Our organizations . . . HAVE PATIENTS/CLIENTS IN COMMON Node color shows Degree Node size shows Betweeness Centrality Graph Density 38%
Our organizations . . . SHARE INFORMATION ABOUT SPECIFIC PATIENTS/CLIENTS Node color shows Degree Node size shows Betweeness Centrality Graph Density 23%
Our organizations . . . SHARE INFORMATION ABOUT PROGRAMS, SERVICES AND/OR POLICY Node color shows Degree Node size shows Betweeness Centrality Graph Density 27%
My organization SENDS REFERRALS TO this organization My organization RECEIVES REFERRALS FROM this organization Node color shows Degree Node size shows Betweeness Centrality Graph Density 46%
Our organizations . . . SHARE RESOURCES (e.g. joint funding, shared equipment, personnel or facilities) Node color shows Degree Node size shows Betweeness Centrality Graph Density 9%
FULL NETWORK all questions Node color shows Network Neighborhood Node size shows Betweeness Centrality Primary care and elder care State services, mental health, child and family services
Middlebury Area Full Network Statistics Average Degree Average number of connections per organization 14.6 Network Diameter Distance (in connections) between the two most distant organizations 2 Graph Density Percentage of possible connections that are active 56% Modularity A measure of how readily the network could dissolve into separate modules .09 Average Shortest Path Length Average shortest distance between organizations (in connections) 1.4
Organization Statistics Organizations Ranked by Betweeness Centrality Betweenness Centrality is a measure of how likely an organization is to appear on the shortest path between any two randomly selected network members. State of VT - Agency of Human Services (AHS) Porter Medical Center - Community Health Team Counseling Services of Addison County (CSAC) State of VT - Vermont Department of Health (VDH) Porter Medical Center - Emergency Department Highest In-Degree In-Degree represents the total number of connections directed in, towards an organization. These are connections reported by another organization, with the exception of referrals from which would be reported by the organization itself. 25 State of VT - Agency of Human Services (AHS) 25 Counseling Services of Addison County (CSAC) 24 Porter Medical Center Community Health Team 24 State of VT - Vermont Department of Health (VDH) 22 Porter Medical Center - Emergency Department
Team Based Care MIDDLEBURY HEALTH SERVICE AREA
Team Based Care % of Respondents who "Agree" or "Strongly Agree" That Their Community Exhibits the Given Team Characteristics 100% 86% 81% 79% 78% 76% 75% 74% 80% 71% 69% 68% 67% 66% 65% 61% 55% 60% 52% 38% 35% 40% 25% 24% 20% 0% Shared Goals Mutual Trust Effective Communications Clear Roles Measureable Processes and Outcomes Middlebury FY14 Middlebury FY15 State Avg. FY 14 State Avg. FY 15
Observations and Questions The biggest change in the Team Based Care measures is a 26% drop in respondents agreeing that organizations in the network have established shared goals. How do community members explain this change? The measures of Mutual Trust and Clear Roles have both improved since the last survey (12% and 16% respectively). Addison County Home Health & Hospice, Cathedral Square SASH Program, Elderly Services, State of VT Vermont Chronic Care Initiative (VCCI), and the Champlain Valley Agency on Aging are all part of the green network neighborhood, brought together in service of the aging and elderly population. Both the Champlain Valley Office of Economic Opportunity (CVOEO) and State of VT Voc Rehab were community additions to the network, suggesting employment may be a key lever this network uses to improve client/patient wellbeing.