Understanding CRO (Cathode Ray Oscilloscope): Working and Applications
In this tutorial on CRO, you will learn about the working principles of a Cathode Ray Oscilloscope (CRO) and its applications in modern electronics. The CRO is crucial for analyzing waveforms by plotting amplitude against the x-axis and y-axis. Explore the components of a CRO and understand how voltage and time describe a shape on the screen. By detecting the electron beam's response to electrical signals, the CRO helps in analyzing properties like amplitude, frequency, rise time, distortion, and time intervals.

Download Presentation

Please find below an Image/Link to download the presentation.
The content on the website is provided AS IS for your information and personal use only. It may not be sold, licensed, or shared on other websites without obtaining consent from the author. Download presentation by click this link. If you encounter any issues during the download, it is possible that the publisher has removed the file from their server.
E N D
Presentation Transcript
Unit-2 Tutorial On CRO (Cathode Ray Oscilloscope) Working and Applications
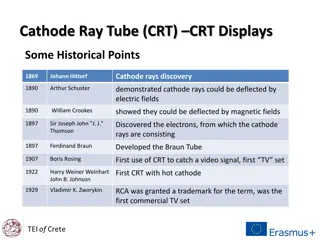
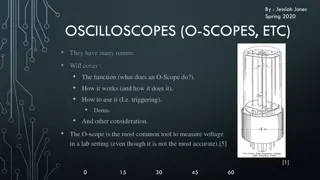
Tutorial On CRO (Cathode Ray Oscilloscope) Working and Applications Introduction: The CRO stands for a cathode ray oscilloscope. In modern electronics, the CRO plays an important role in the electronic circuits. It is typically divided into four sections which are display, vertical controllers, horizontal controllers, and Triggers. Most of the oscilloscopes are used the probes and they are used for the input of any instrument. We can analyze the waveform by plotting amplitude along with the x-axis and y-axis.
Tutorial On CRO (Cathode Ray Oscilloscope) Working and Applications What Is A CRO The cathode ray oscilloscope is an electronic test instrument. It is used to obtain waveforms when the different input signals are given. In the early days, it is called as an Oscillograph. The oscilloscope observes the changes in the electrical signals over time.
Tutorial On CRO (Cathode Ray Oscilloscope) Working and Applications What Is A CRO Thus the voltage and time describe a shape and it is continuously graphed beside a scale. By seeing the waveform, we can analyze some properties like amplitude, frequency, rise time, distortion, time interval and etc.
Tutorial On CRO (Cathode Ray Oscilloscope) Working and Applications What is a CRO Cathode Ray Oscilloscope
Tutorial On CRO (Cathode Ray Oscilloscope) Working and Applications Block Diagram of CRO Block Diagram of CRO
Tutorial On CRO (Cathode Ray Oscilloscope) Working and Applications Block Diagram of CRO The CRO recruit the cathode ray tube and acts as a heat of the oscilloscope. In an oscilloscope, the CRT produces the electron beam which is accelerated to a high velocity. It brings to the focal point on a fluorescent screen.
Tutorial On CRO (Cathode Ray Oscilloscope) Working and Applications Block Diagram of CRO Thus, the screen produces a visible spot where the electron beam strikes with it. By detecting the beam above the screen in reply to the electrical signal. The electrons can act as an electrical pencil of light which produces a light where it strikes.
Tutorial On CRO (Cathode Ray Oscilloscope) Working and Applications Block Diagram of CRO To complete this task we need various electrical signals and voltages. This provides the power supply circuit of the oscilloscope. Here we will use high voltage and low voltage. The low voltage is used for the heater of the electron gun to generate the electron beam. The high voltage is required for the cathode ray tube to speed up the beam.
Dual trace CRO Dual beam CRO It is used single electron beam to display two traces. It is used two electron beams for displaying two signals. Two vertical amplifiers are used for two beams. A single vertical amplifier is used. It is not able to capture two fast transient events. It is captures two fast transient easily. It cannot switch quickly between traces, so simultaneous display becomes difficult. It can display two traces simultaneously. The two signals must have the same frequency or they must be harmonically related. The two signals may or may not have same frequency. A single beam can be used for displaying multiple traces. Multiple beams are used for displaying multiple traces. Two signals can be displayed on a dual trace oscilloscope. But, the two signals cannot be displayed together in real time. Two signals can be displayed simultaneously in real time.
CRO Probes: The simplest types of probe (one can hardly call it a probe) is the test lead. Test leads are simply convenient lengths of wire for connecting the CRO input to the point of observation. At the CRO end, they usually terminate with lugs, banana tips or other tips to fit the input jacks of the scope, and at the other end have a crocodile clip or any other convenient means for connection to the electronic circuit.
The input impedances of most CROs are relatively very high compared to the circuits where they are connected, it is often desirable to increase their impedance to avoid loading of the circuits or causing unstable effects. Classification of CRO Probes: i) Direct probes (1:1) or Isolatio Probe ii) Passive Probe (10:1) or High Impedance probe iii) Active Probe
Direct probes (1:1) or Isolation Probe: The input capacitance of the scope, plus the stray capacitance of the test leads, may be just enough to cause a sensitive circuit to break into Fig. 7.44 me Isolation Probe oscillation when the CRO is connected. This effect can be prevented by an isolation probe made by placing a carbon resistor in series with the test lead, as shown in Fig. 7.44.
Passive Probe (10:1) or High Impedance probe: The capacitor is adjusted so that the elements of the bridge are balanced. Under conditions of balance we have,
X and Y are equipotential The attenuation of the signal is 10 : 1, i.e. (R1 + Rin)/ Rin = 10 : 1 over a wide frequency range. Therefore, the input capacitance of a CRO can range from 15-50 pF. C1 should be adjusted from 13-47 pF.
Active Probe: Active probes are designed to provide an efficient method of coupling high frequency, fast rise time signals to the CRO input. Usually active probes have very high input impedance, with less attenuation than passive probes. Active devices may be diodes, FETs, BJTs, etc. Active probes are more expensive and bulky than passive probes, but they are useful for small signal measurements, because their attenuation is less.
Figure 7.46 shows a basic circuit of an active probe using a FET.
The voltage gain of the FET follower circuit shown is unity, the follower circuit provides a power gain so that the input impedance can be increased.
SAMPLING OSCILLOSCOPE(VHF): An ordinary Sampling Oscilloscope has a B.W. of 10 MHz. The HF performance can be improved by means of sampling the input waveform and reconstructing its shape from the sample. The shape of the waveform is reconstructed by joining the sample levels together. The sampling frequency may be as low as 1/10th of the input signal frequency (if the input signal frequency is 100 MHz, the bandwidth of the CRO vertical amplifier can be as low as 10 MHz). As many as 1000 samples are used to reconstruct the original waveform.
The input waveform is applied to the sampling gate. The input waveform is sampled whenever a sampling pulse opens the sampling gate. The sampling must be synchronised with the input signal frequency. The signal is delayed in the vertical amplifier, allowing the horizontal sweep to be initiated by the input signal.
At the beginning of each sampling cycle, the trigger pulse activates an oscillator and a linear ramp voltage is generated. This ramp voltage is applied to a voltage comparator which compares the ramp voltage to a staircase generator. When the two voltages are equal in amplitude, the staircase advances one step and a sampling pulse is generated, which opens the sampling gate for a sample of input voltage.
The resolution of the final image depends upon the size of the steps of the staircase generator. The smaller the size of the steps the larger the number of samples and higher the resolution of the image. Advantage: it can measure the very high-speed event with the help of the instrument having lower bandwidth. Disadvantages: (i) that it can only measure the repetitive or continuous signal. (ii) The frequency range of the oscilloscopes depend on their design.
Digital Storage Oscilloscope: Definition: The digital storage oscilloscope is defined as the oscilloscope which stores and analysis the signal digitally, (i.e. in the form of 1 or 0) preferably storing them as analogue signals. The digital oscilloscope takes an input signal, store them and then display it on the screen. The digital oscilloscope has advanced features of storage, measurement. Also, signal visually as well as numerically. triggering displays and the it
The digital oscilloscope digitizes and stores the input signal. This can be done by the use of CRT and digital memory. The digitization can be done by taking the sample input signals at periodic waveforms. The maximum frequency of the signal which is measured by the digital oscilloscope depends on the two factors. Theses factors are the (i) Sampling rate (ii) Nature of converter.
DIGITAL FREQUENCY COUNTER Digital frequency counters that use a direct counting approach, count the number of times the input signal crosses a given trigger voltage (and in a given direction, e.g. moving from negative to positive) in a given time. This time is known as the gate time
DIGITAL FREQUENCY COUNTER Contd Input: When the signal enters the frequency counter it enters the input amplifier where the signal is converted into a logic rectangular wave for processing within the digital circuitry in the rest of the counter. Normally this stage contains a Schmitt trigger circuit so that noise does not cause spurious edges that would give rise to additional pulses that would be counted.
DIGITAL FREQUENCY COUNTER Contd Accurate time-base / clock: In order to create the various gate / timing signals within the frequency counter an accurate timebase or clock is required. This is typically is a crystal oscillator and in high quality test instruments it will be an oven controlled crystal oscillator. In many instruments, there will be the capability to use a better quality external oscillator, or to use the frequency counter oscillator for other instruments. This is also beneficial when it is necessary to lock a number of instruments to the same standard.
DIGITAL FREQUENCY COUNTER Contd Decade dividers and flip-flop: The clock oscillator is used to provide an accurately timed gate signal that will allow through pulses from the incoming signal. This is generated from the clock by dividing the clock signal by decade dividers and then feeding this into a flip flop to give the enabling pulse for the main gate
DIGITAL FREQUENCY COUNTER Contd Decade dividers and flip-flop: The clock oscillator is used to provide an accurately timed gate signal that will allow through pulses from the incoming signal. This is generated fromth e clock by dividing the clock signal by decade dividers and then feeding this into a flip flop to give the enabling pulse for the main gate
DIGITAL FREQUENCY COUNTER Contd Counter/ latch: The counter takes the incoming pulses from the gate. It has a set of divide-by-10 stages (number equal to the number of display digits minus 1). Each stage divides by ten and therefore as they are chained the first stage is the input divided by ten, the next is the input divided by 10 x 10, and so forth. These counter outputs are then used to drive the display.
DIGITAL FREQUENCY COUNTER Contd Display: The display takes the output from the latch and displays it in a normal readable format. LCD, or LED displays are the most common. There is a digit for each decade the counter can display. Obviously other relevant information may be displayed on the display as well.
Gate: the clock is applied to one input of a gate and the other has a train of pulses from the incoming signal. The resultant output from the gate is a series of pulses for a precise amount of time. For example if the incoming signal was at 1 MHz and the gate was opened for 1 second, then 1 million pulses would be allowed through. The precisely timed gate enabling signal from
Sampling Rate: The sampling theory states that the sampling rate of the signal must be twice as fast as the highest frequency of the input signal. The sampling rate means analogue to digital converter has a high fast conversion rate. Converter The converter uses the expensive flash whose resolution decreases with the increases of a sampling rate. Because of the sampling rate, the bandwidth and resolution of the oscilloscope are limited.
The need of the analog to digital signal converters can also be overcome by using the shift register. The input signal is sampled and stored in the shift register. From the shift register, the signal is slowly read out and stored in the digital form. This method reduces the cost of the converter and operates up to 100 megasample per second. The only disadvantage of the digital oscilloscope is that it does not accept the data during digitisation, so it had a blind spot at that time.
Waveform Reconstruction: For visualising the final wave, the oscilloscopes use the technique of inter-polarization. The inter-polarization is the process of creating the new data points with the help of known variable data points. Linear interpolation are the two processes of connecting the points together. interpolation and sinusoidal


 or Isolation Probe:")
 or High Impedance probe:")
 or High Impedance probe:")


:")
:")