The Changing Landscape of Global Hunger: Agriculture, Policy, and Nutrition Transitions
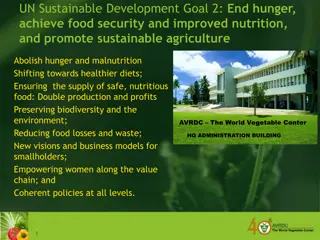
The discourse on global hunger is evolving with a focus on transitions in agriculture, public policy, and nutrition. Recent developments highlight shifts towards improved food quality, changing agricultural practices, and evolving gender roles. Key factors include decreasing farm populations, increasing commercialization of food markets, and a shift from infectious to non-communicable diseases. The narrative underscores the need for renewed attention to diet quality and holistic approaches to address food insecurity.

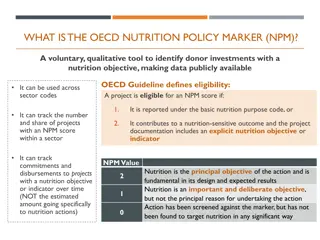
Download Presentation

Please find below an Image/Link to download the presentation.
The content on the website is provided AS IS for your information and personal use only. It may not be sold, licensed, or shared on other websites without obtaining consent from the author. Download presentation by click this link. If you encounter any issues during the download, it is possible that the publisher has removed the file from their server.
E N D
Presentation Transcript
The Big Picture for Global Hunger: Transitions in Agriculture, Public Policy, and Nutrition Will Masters Friedman School of Nutrition Science & Policy, Tufts University www.nutrition.tufts.edu | http://sites.tufts.edu/willmasters Weatherhead Center for International Affairs Workshop on the Sustainability of the World's Food and Farming Systems 18 March 2016
Yesterdays news Also, this:
The race against Malthus is changing We are here Source: K. Fuglie and S. L. Wang, New Evidence Points to Robust but Uneven Productivity Growth in Global Agriculture, Amber Waves, September 2012. Washington: Economic Research Service, USDA.
The agriculture-to-nutrition transition in food supplies Horizontal movements = more (or less) food Diagonal movements = more and different foods Source: Author s calculations from FAO Food Balance Sheets, http://faostat3.fao.org/download/FB/FBS/E (June 2015).
The agriculture-to-nutrition transition in English-language books Other search terms show similar switch from ag. to nutrition agricultural change agricultural transformation nutrition transition Source: Google Ngrams, downloaded July 2015 from books.google.com/ngrams/graph?content=agricultural+change, agricultural+transformation,nutrition+transition&case_insensitive=on&year_start=1985&year_end=2015&smoothing=0.
Nutrition transition and agricultural transformation What has changed? Fifteen years into the 21st c., we have: Renewed and changing attention to food Much new attention to diet quality and nutritional influences on health Many new food-related technologies, policies and public-sector programs Rapid transformation of agriculture and food systems Farm population and area growth is slowing or has stopped Food markets are rapidly commercializing & intensifying everywhere Gender roles are changing, in households and in education/employment Rapid transition in demography and disease Child mortality and birth rates are declining or already low Disease burdens shift from infectious to non-communicable diseases In shift from under- to over-consumption, diets remain #1 health risk
Nutrition transition and agricultural transformation Is all this change just more of the same? Method test for shifts in the global average at each level of national income this generalizes the Preston curve (Preston 1975, Bloom & Canning 2007), first applied to life expectancy all results are nationally representative, weighted by population each test uses all available countries, then subsets of countries Data national income: health outcomes: burden of disease (diabetes and diarrhea) body size: heights and weights (obesity, stunting, wasting) diet quality: intake of healthy & unhealthy foods ag. transformation: rural pop. growth, ag. employment and earnings policy choices: price effects of agricultural policies purchasing power per capita
Nutrition transition and agricultural transformation health | body size | diet quality | agriculture | policy We can look only where there is data National income GDP per capita at PPP prices, from Penn World Tables 8.1 Health Fraction of DALYs lost, from Global Burden of Disease study Body size Height and weight Z scores, from GBD estimates and survey data Diet quality Lower- and higher-risk foods, from dietary recall and modeled estimates Agriculture Rural pop. growth, ag. employment & earnings from ILO, UNPP and WB Policy choices Price comparisons from WB Distortions to Agricultural Incentives project
Nutrition transition and agricultural transformation health | body size | diet quality | agriculture | policy Start with the signature diet-related disease: diabetes
Nutrition transition and agricultural transformation health | body size | diet quality | agriculture | policy Diabetes burdens in 1990 The global burden of diabetes (share of DALYs lost) Modeled estimates for 1990 in 162 countries A clear income gradient but also more variance at higher incomes .1 .08 at each level of national income Share of total DALYs lost .06 .04 .02 0 500 1,000 2,000 4,000 8,000 16,000 32,000 Real GDP per capita at PPP prices (2005 USD), log scale Note: Symbols are sized by population, with year shown as 1990=green circles. Source: Global Burden of Disease Study, Results by Cause; GDP and population are from PWT 8.1.
Nutrition transition and agricultural transformation health | body size | diet quality | agriculture | policy Diabetes burdens in 1990, with local means The global burden of diabetes (share of DALYs lost) Modeled estimates for 1990 in 162 countries .1 Note the wider confidence interval at higher incomes .08 at each level of national income Share of total DALYs lost .06 .04 Note India and China are near their local means .02 0 500 1,000 2,000 4,000 8,000 16,000 32,000 Real GDP per capita at PPP prices (2005 USD), log scale Note: Symbols are sized by population, with year shown as 1990=green circles. Lines show each year's local means and confidence intervals estimated by -lpolyci-, weighted by population and with a bandwidth of 0.75. Source: Global Burden of Disease Study, Results by Cause; GDP and population are from PWT 8.1.
Nutrition transition and agricultural transformation health | body size | diet quality | agriculture | policy Changes in diabetes from 1990 to 2005 The global burden of diabetes (share of DALYs lost) Modeled estimates for 1990 and 2005 in 162 countries India and .1 China shifted up and along the same curves as other countries at each level of national income From 1990 to 2005, relative burden rose in lower and middle income countries .08 Share of total DALYs lost .06 .04 .02 0 500 1,000 2,000 4,000 8,000 16,000 32,000 Real GDP per capita at PPP prices (2005 USD), log scale Note: Symbols are sized by population, with year shown as 1990=green circles and 2005=red triangles. Lines show each year's local means and confidence intervals estimated by -lpolyci-, weighted by population and with a bandwidth of 0.75. Source: Global Burden of Disease Study, Results by Cause; GDP and population are from PWT 8.1.
Nutrition transition and agricultural transformation health | body size | diet quality | agriculture | policy Diabetes burdens have risen in poor countries The global burden of diabetes (share of DALYs lost) Modeled estimates for 1990, 2005 and 2010 in 162 countries China and India remain near their local means .15 O = 1990 = 2005 = 2010 The change was from 1990 to 2005; no significant further rise to 2010 at each level of national income Share of total DALYs lost .1 .05 0 500 1,000 2,000 4,000 8,000 16,000 32,000 Real GDP per capita at PPP prices (2005 USD), log scale Note: Symbols are sized by population, with year shown as 1990=green circles, 2005=red triangles, and 2010=blue squares. Lines show each year's local means and confidence intervals estimated by -lpolyci-, weighted by population and with a bandwidth of 0.75. Source: Global Burden of Disease Study, Results by Cause; GDP and population are from PWT 8.1.
Nutrition transition and agricultural transformation health | body size | diet quality | agriculture | policy Now contrast with the signature illness of undernourishment: diarrheal disease
Nutrition transition and agricultural transformation health | body size | diet quality | agriculture | policy Diarrheal disease burdens have fallen The global burden of diarrheal disease (share of DALYs lost) Modeled estimates for 1990, 2005 and 2010 in 162 countries O = 1990 .2 = 2005 = 2010 India remains an outlier What happened at each income level other than India & China? at each level of national income .15 Share of total DALYs lost .1 .05 China 0 500 1,000 2,000 4,000 8,000 16,000 32,000 Real GDP per capita at PPP prices (2005 USD), log scale Note: Symbols are sized by population, with year shown as 1990=green circles, 2005=red triangles, and 2010=blue squares. Lines show each year's local means and confidence intervals estimated by -lpolyci-, weighted by population and with a bandwidth of 0.75. Source: Global Burden of Disease Study, Results by Cause; GDP and population are from PWT 8.1.
Nutrition transition and agricultural transformation health | body size | diet quality | agriculture | policy Diarrheal disease burdens have fallen very fast The global burden of diarrheal disease (excl. China & India) Modeled estimates for 1990, 2005 and 2010 in 160 countries .2 O = 1990 = 2005 = 2010 at each level of national income .15 Share of total DALYs lost Relative burdens fell most in the poorest countries .1 .05 0 500 1,000 2,000 4,000 8,000 16,000 32,000 Real GDP per capita at PPP prices (2005 USD), log scale Note: Symbols are sized by population, with year shown as 1990=green circles, 2005=red triangles, and 2010=blue squares. Lines show each year's local means and confidence intervals estimated by -lpolyci-, weighted by population and with a bandwidth of 0.75. Source: Global Burden of Disease Study, Results by Cause; GDP and population are from PWT 8.1.
Nutrition transition and agricultural transformation health | body size | diet quality | agriculture | policy The most visible kind of change: adult obesity
Nutrition transition and agricultural transformation health | body size | diet quality | agriculture | policy Adult obesity had a clear income gradient in 1990 Global prevalence of obesity (share of adults aged 20+) Modeled estimates for 1990 in 162 countries .6 Proportion of adults aged 20+ who are obese at each level of national income .4 .2 0 500 1,000 2,000 4,000 8,000 16,000 32,000 Real GDP per capita at PPP prices (2005 USD), log scale Note: Symbols are sized by population, with year shown as 1990=green circles. Lines show each year's local means and confidence intervals estimated by -lpolyci-, weighted by population and with a bandwidth of 0.75. Source: Global Burden of Disease Study; GDP and population are from PWT 8.1.
Nutrition transition and agricultural transformation health | body size | diet quality | agriculture | policy From 1990 to 2010, did the income gradient shift? Global prevalence of obesity (share of adults aged 20+) Modeled estimates for 1990, 2005 & 2010 in 162 countries .6 O = 1990 Proportion of adults aged 20+ who are obese = 2005 = 2010 at each level of national income .4 .2 But China and India may be influential 0 500 1,000 2,000 4,000 8,000 16,000 32,000 Real GDP per capita at PPP prices (2005 USD), log scale Note: Symbols are sized by population, with year shown as 1990=green circles, 2005=red triangles, and 2010=blue squares. Lines show each year's local means and confidence intervals estimated by -lpolyci-, weighted by population and with a bandwidth of 0.75. Source: Global Burden of Disease Study; GDP and population are from PWT 8.1.
Nutrition transition and agricultural transformation health | body size | diet quality | agriculture | policy Adult obesity has shifted up in richer countries Global prevalence of obesity (share of adults aged 20+) Model estimates for 1990, 2005 & 2010 in 160 countries, ex. China & India O = 1990 = 2010 .6 Proportion of adults aged 20+ who are obese = 2005 at each level of national income .4 .2 Outside of China & India the gradient is now steeper 0 500 1,000 2,000 4,000 8,000 16,000 32,000 Real GDP per capita at PPP prices (2005 USD), log scale Note: Symbols are sized by population, with year shown as 1990=green circles, 2005=red triangles, and 2010=blue squares. Lines show each year's local means and confidence intervals estimated by -lpolyci-, weighted by population and with a bandwidth of 0.75. Source: Global Burden of Disease Study; GDP and population are from PWT 8.1.
Nutrition transition and agricultural transformation health | body size | diet quality | agriculture | policy The main development goal: child stunting
Nutrition transition and agricultural transformation health | body size | diet quality | agriculture | policy Child stunting rates have shifted down UNICEF/WHO/WB survey data on prevalence of child stunting, 1985-2011 Pct. of children under 5, 1985-99 [n=250] and 2000-11 [n=337]) 80 O = 1985-99 = 2000-11 Pct. of children under 5 with HAZ<-2 at each level of national income 60 40 20 0 500 1,000 2,000 4,000 8,000 16,000 32,000 Real GDP per capita at PPP prices (2005 USD), log scale Note: Symbols are sized by population, with decades shown by green circles for 1986-99 (250 surveys in 103 countries) and blue squares for 2000-2011 (337 surveys in 117 countries). Lines show local means and confidence intervals for each period estimated by -lpolyci-, weighted by population and with a bandwidth of 0.75. Source: World Bank, WHO and UNICEF joint data; GDP and population are from PWT 8.1.
Nutrition transition and agricultural transformation health | body size | diet quality | agriculture | policy Outside China and India, child stunting has shifted down the most for the poorest UNICEF/WHO/WB data on child stunting (excl. India & China), 1985-2011 Pct. of children under 5, in 1985-99 [n=240] and 2000-11 [n=330] 80 O = 1985-99 = 2000-11 Pct. of children under 5 with HAZ<-2 at each level of national income 60 40 20 0 500 1,000 2,000 4,000 8,000 16,000 32,000 Real GDP per capita at PPP prices (2005 USD), log scale Note: Symbols are sized by population, with decades shown by green circles for 1986-99 (240 surveys in 101 countries) and blue squares for 2000-2011 (330 surveys in 115 countries). Lines show local means and confidence intervals for each period estimated by -lpolyci-, weighted by population and with a bandwidth of 0.75. (Excludes India and China.) Source: World Bank, WHO & UNICEF joint data; GDP and population are from PWT 8.1.
Nutrition transition and agricultural transformation health | body size | diet quality | agriculture | policy Child stunting has shifted down within Africa UNICEF/WHO/WB data on child stunting in Africa, 1985-2011 Pct. of children under 5, in 1985-99 [n=84] and 2000-11 [n=123] 80 O = 1985-99 = 2000-11 Pct. of children under 5 with HAZ<-2 at each level of national income 60 40 20 0 500 1,000 2,000 4,000 8,000 16,000 32,000 Real GDP per capita at PPP prices (2005 USD), log scale Note: Symbols are sized by population, with decades shown by green circles for 1986-99 (84 surveys in 40 countries) and blue squares for 2000-2011 (123 surveys in 42 countries). Lines show local means and confidence intervals for each period estimated by -lpolyci-, weighted by population and with a bandwidth of 0.75. Source: World Bank, WHO & UNICEF joint data; GDP and population are from PWT 8.1.
Nutrition transition and agricultural transformation health | body size | diet quality | agriculture | policy Less prevalent, but still serious: child wasting
Nutrition transition and agricultural transformation health | body size | diet quality | agriculture | policy Child wasting rates have also fallen UNICEF/WHO/WB survey data on prevalence of child wasting, 1985-2011 Pct. of children under 5, in 1985-99 [n=244] and 2000-11 [n=333] 25 O = 1985-99 = 2000-11 Pct. of children under 5 with WHZ<-2 at each level of national income 20 15 10 5 0 500 1,000 2,000 4,000 8,000 16,000 32,000 Real GDP per capita at PPP prices (2005 USD), log scale Note: Symbols are sized by population, with decades shown by green circles for 1986-99 (244 surveys in 102 countries) and blue squares for 2000-2011 (333 surveys in 116 countries). Lines show local means and confidence intervals for each period estimated by -lpolyci-, weighted by population and with a bandwidth of 0.75. Source: World Bank, WHO and UNICEF joint data; GDP and population are from PWT 8.1.
Nutrition transition and agricultural transformation health | body size | diet quality | agriculture | policy Child wasting has fallen outside China & India, too UNICEF/WHO/WB data on child wasting (excl. India & China), 1985-2011 Pct. of children under 5, in 1985-99 [n=234] and 2000-11 [n=326] 25 O = 1985-99 = 2000-11 Pct. of children under 5 with HAZ<-2 at each level of national income 20 15 10 5 0 500 1,000 2,000 4,000 8,000 16,000 32,000 Real GDP per capita at PPP prices (2005 USD), log scale Note: Symbols are sized by population, with decades shown by green circles for 1986-99 (234 surveys in 100 countries) and blue squares for 2000-2011 (326 surveys in 114 countries). Lines show local means and confidence intervals for each period estimated by -lpolyci-, weighted by population and with a bandwidth of 0.75. (Excludes India and China.) Source: World Bank, WHO & UNICEF joint data; GDP and population are from PWT 8.1.
Nutrition transition and agricultural transformation health | body size | diet quality | agriculture | policy What has happened to diet quality?
Nutrition transition and agricultural transformation health | body size | diet quality | agriculture | policy Food balance sheets are useful, but limited Source: Author s calculations from FAO Food Balance Sheets, http://faostat3.fao.org/download/FB/FBS/E (June 2015).
Nutrition transition and agricultural transformation health | body size | diet quality | agriculture | policy Diet quality is multi-dimensional The GBD Nutrition and Chronic Diseases Expert Group (NutriCoDE) approach: More healthy foods Diet score is higher (better) for more intake of protective, lower-risk items: Fruits, vegetables, fish, milk, beans & legumes, nuts & seeds Whole grains, fiber Polyunsaturated fatty acids, plant omega-3s Less unhealthy foods Diet score is higher (better) for less intake of unhealthy, higher-risk items: Sugar-sweetened beverages Red meats, processed meats Saturated fat, trans fat, dietary cholesterol Sodium Source: Imamura et al. (2015). Dietary quality among men and women in 187 countries in 1990 and 2010: a systematic assessment. Lancet Global Health, 3(3), e132-e142.
Nutrition transition and agricultural transformation health | body size | diet quality | agriculture | policy Imamura et al. index of healthy food use Diet quality scores based on more intake of 10 healthier foods, 1990-2010 (Modeled estimates for 1990 and 2010 in 161 countries - excl. China & India) 80 Mean healthy-food consumption score (0-100) at each level of national income 60 40 20 Positive gradient starts at about $4,000, and shifts up at about $16,000 O = 1990 = 2010 0 500 1,000 2,000 4,000 8,000 16,000 32,000 Real GDP per capita at PPP prices (2005 USD), log scale Note: Symbols are sized by population, with year shown as 1990=green circles, 2010=blue squares. Diet score is scaled so that higher values = more intake of 10 healthy items: fruits, fruits, vegetables, beans and legumes, nuts and seeds, whole grains, milk, polyunsaturated fatty acids, fish, plant omega-3s, and dietary fibre. Lines show means and confidence intervals estimated by lpolyci, weighted by population and with a bandwidth of 0.75. Source: Nutrition and Chronic Diseases Expert Group (NutriCoDE); GDP and population are from PWT 8.1.
Nutrition transition and agricultural transformation health | body size | diet quality | agriculture | policy Imamura et al. index of unhealthy food use Diet quality scores based on less intake of 7 unhealthy foods, 1990-2010 (Modeled estimates for 1990 and 2010 in 161 countries - excl. China & India) 100 Negative gradient flattens after $16,000. Means improved from 1990 to 2010 but not significantly Mean unhealthy diet score (0-100) at each level of national income 80 60 40 O = 1990 = 2010 20 500 1,000 2,000 4,000 8,000 16,000 32,000 Real GDP per capita at PPP prices (2005 USD), log scale Note: Symbols are sized by population, with year shown as 1990=green circles, 2010=blue squares. Diet score is scaled so that higher values = less intake of 7 unhealthy items: Red meats, processed meats, sugar-sweetened beverages, saturated fat, trans fat, dietary cholesterol, and sodium. Lines show means and confidence intervals estimated by lpolyci, weighted by population and with a bandwidth of 0.75. Source: Nutrition and Chronic Diseases Expert Group (NutriCoDE); GDP and population are from PWT 8.1.
Nutrition transition and agricultural transformation health | body size | diet quality | agriculture | policy We can look for similar shifts in: agricultural transformation
Nutrition transition and agricultural transformation health | body size | diet quality | agriculture | policy The poorest still have rapid rural population growth Annual growth of the rural population, excluding outliers and India & China Modeled estimates for 1990, 2000 and 2010 in 165 countries Annual rate of change in the rural population (pct/yr) 5 at each level of national income 0 O = 1990 = 2000 = 2010 -5 500 1,000 2,000 4,000 8,000 16,000 32,000 Real GDP per capita at PPP prices (2005 USD), log scale Note: Symbols are sized by population, with year shown as 1991=green circles, 2000=red triangles, 2010=blue squares. Lines show means and confidence intervals for each year at each level of income, estimated by -lpolyci- with population weights and a bandwidth of 0.75. Excluded outliers are Afghan., Andorra & Falkland Is. in 1990, Andorra & W.Sah. in 2000, Japan in 2010. Source: UN (2013) World Population Prospects; GDP and population from PWT 8.1.
Nutrition transition and agricultural transformation health | body size | diet quality | agriculture | policy The poorest still have large majorities on farms Share of total employment in agriculture, without China and India Modeled estimates for 1991, 2000 and 2010 in 154 countries 1 Share of total employment in agriculture .8 at each level of national income .6 .4 O = 1990 = 2000 = 2010 .2 0 500 1,000 2,000 4,000 8,000 16,000 32,000 Real GDP per capita at PPP prices (2005 USD), log scale Note: Symbols are sized by population, with year shown as 1991=green circles, 2000=red triangles, 2010=blue squares. Lines show means and confidence intervals for each year at each level of income, estimated by -lpolyci- with population weights and a bandwidth of 0.75. Agriculture includes forestry, hunting and fishing. Source: ILO (2015) WESO Trends 2015; GDP and population are from PWT 8.1.
Nutrition transition and agricultural transformation health | body size | diet quality | agriculture | policy Only for the richest have farm earnings shifted up Labor productivity in agric. vs. other sectors, excl. India & 3 small outliers Modeled estimates for 1991 [n=81], 2000 [n=113] and 2010 [n=118] Ratio of ag VA per ag worker to non-ag VA per non-ag worker 1.5 O = 1990 = 2000 = 2010 at each level of national income 1 .5 0 500 1,000 2,000 4,000 8,000 16,000 32,000 Real GDP per capita at PPP prices (2005 USD), log scale Note: Symbols are sized by population, with year shown as 1991=green circles, 2000=red triangles, 2010=blue squares. Lines show means and confidence intervals for each year at each level of income, estimated by -lpolyci- with population weights and a bandwidth of 0.75. Excluded outliers are Guyana in 2000, Slovenia and Malta in 2010. Source: ILO (2015) WESO Trends 2015 & World Bank 2015; GDP and population are from PWT 8.1.
Nutrition transition and agricultural transformation health | body size | diet quality | agriculture | policy How have governments responded? food price policy
Nutrition transition and agricultural transformation health | body size | diet quality | agriculture | policy Food policy s development paradox is no longer Consumer Tax Equivalent (CTE) of all agricultural policies Value-weighted effect on food prices in 1990, 2000 and 2010 Tariff-equivalent effect of all farm and food policies 3 O = 1990 = 2000 = 2010 at each level of national income 2 1 0 -1 500 1,000 2,000 4,000 8,000 16,000 32,000 Real GDP per capita at PPP prices (2005 USD), log scale Note: Symbols are sized by population, with decades shown by green circles for 1990 (62 countries), red triangles for 2000 (77 countries) and blue squares for 2010 (69 countries). Lines show local means and confidence intervals for each year estimated by -lpolyci-, weighted by population and with a bandwidth of 0.75. Source: World Bank, Distortions to Agricultural Incentives project; GDP and population from PWT 8.1.
Nutrition transition and agricultural transformation health | body size | diet quality | agriculture | policy Food policy s pro-staples bias is diminished Consumer Tax Equivalent (CTE) on F&V versus starchy staples Ave. effect on F&V/starchy staple price ratios in 1990, 2000 and 2010 Tariff-equivalent effect of policy on F&V to starchy staple price ratio 1 O = 1990 = 2000 = 2010 at each level of national income .5 0 -.5 500 1,000 2,000 4,000 8,000 16,000 32,000 Real GDP per capita at PPP prices (2005 USD), log scale Note: Symbols are sized by population, with decades shown by green circles for 1990 (29 countries), red triangles for 2000 (31 countries) and blue squares for 2010 (33 countries). Lines show local means and confidence intervals for each year estimated by -lpolyci-, weighted by population and with a bandwidth of 0.75. Source: World Bank, Distortions to Agricultural Incentives; GDP and population from PWT 8.1.
Nutrition transition and agricultural transformation Conclusions: what we ve seen so far Fifteen years into the 21st century, what s changed? The Preston curve approach reveals a lot: The present is like the past, only more so most change is movement along a stable development path -- although some variables have shifted, at some income levels Significant global shifts include: for the poorest, much less stunting, wasting and diarrheal disease at middle-income levels, more diabetes and other diet-related disease in the richest countries, more obesity but also more healthy food intake The most surprising shifts may be in policy choices no longer pushing food prices down in poor countries/up in rich countries no longer keeping starchy staples cheaper than F&V
Nutrition transition and agricultural transformation Conclusions: can we bend these curves? Looking forward, what can we learn from the past? Bending these curves requires concerted action: To complete the eradication of undernutrition --sharp declines have been achieved by both shifting & moving along the curves To treat the existing burden of diet-related disease --at higher incomes diabetes is controlled, despite rising obesity To prevent future increases in diet-related disease upward shifts in the income gradient for obesity may be reversible To take advantage of changes in food price policy ending policies that favor starchy staples creates incentives for new investment But note the evidence is still very limited! Many results rest on inference from few observations We can only see where there is data.
Acknowledgements Anaya Hall, Elena Martinez, Peilin Shi, Gitanjali Singh, Patrick Webb and Dariush Mozaffarian Feed the Future Policy Impact Study Consortium Funded by USAID Global Nutrition and Policy Consortium Funded by BMGF: www.globaldietarydatabase.org Feed the Future Innovation Lab for Nutrition Funded by USAID: www.nutritioninnovationlab.org