Evolution of Insurance Markets

 undefined

Burning Cost
Agenda
De tariff cycle - learning from other markets
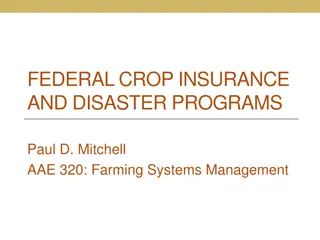
China – Evolution of Distribution, Regulation & Pricing
6 Years
2003 – 2006
1H
2006 2H -
2008
2009-2011
2012
+
To 2002
Sales Staff, Agency,
Call Center, Cross Sell
Sales Staff,
Agency
Sales Staff,
Agency
Sales Staff, Agency,
Call Center, Cross
Sell
Sales Staff
Distribution
Tariff Reform
File and use
Tariff
Tariff,
Strengthened
Market Practice
Guideline
Tariff
Rate Regulation
GLM and more
advanced risk
classification gain
momentum
Basic Risk
Segmentation
Some Insurers
successfully
adopted GLM
Pricing
Technology
•
Deep Discount from previous tariff price offered by
many insurers.
•
Regulators concerned by increased solvency risk
•
Stiff Tariff-market but it is moving
towards detariffication again
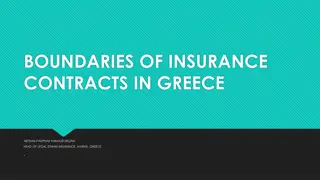
Historical underwriting results of Chinese local market
Millions RMB
Data Resource: CIRC, China Insurance YearBook, Annual Statements for P&C insurers, Towers Watson
Data are for all domestic P&C insurers combines.
Japan
Market agreement between
market players to control price
Combined Ratio
Detarrification in 1998
Massive erosion in premium
Triggers consolidation
Large agents close down
Gives rise to increase in solicitors
Mergers and Acquisitions
Agenda
Global Property Market Scenario: Pricing
and Market Capacities
Source: www. axco.co.uk – Country specific Insurance market research papers
Period: 2010-11 to 2012-13
Gross Premium and Capacity in INR Mn
Loss Ratio : Industry trend
Source: IRDA published Numbers
Period: 2007-08 to 2013-14
I.
Loss ratio’s across products are consistently on an higher side for major
products in General Insurance Industry
II.
No benchmark data available for pricing the risk
Regulator Intervention on Price
IIB Approach to Burning rates
Agenda
Challenge with current Burn cost approach
Exposure based pricing
Threshold for large loss
Separate losses into attritional and large
Threshold is estimated separately for each risk band
Probability of claims greater than threshold is low
Large losses are low frequency-high severity
Attritional
Large Loss
Estimating large loss load
Agenda
Burning cost for GHI
Can industry wide loss cost per life per SI be collated?
Demography (Age, Gender)
Coverages (say maternity, PED etc)
Copay, deductibles and sublimits customized for each risk
Location (Tier I, Tier II; spread of lives in Tier I and Tier II)
Complex equation; numerous
permutation and combination;
Per life risk rate not possible
Possible approach
Segment wise approach
One approach will not suit all types of policies
Burning cost methodology v/s standard risk rate
Rather than quantifying the burning cost, the approach to be
adopted need to be agreed upon
Policies with GWP >25 Lacs
Standard methodology of burning cost to be agreed
Factors to be considered to be standardized (IBNR, O/S claims,
medical inflation)
Policy level LR not to exceed threshold LR (recommended at 90%)
incl IBNR
Reporting to board for deviation cases
Policies with GWP <25 Lacs
Portfolio level monitoring
Agenda
Way Forward
Thank You
The content explores the evolution of insurance markets in different regions such as China, Japan, and India. It discusses topics like detariffication, market forces, regulatory interventions, historical underwriting results, and the impact of mergers and acquisitions on the industry. The evolution of distribution, regulation, pricing strategies, and market behavior over the years is also highlighted.

Download Presentation

Please find below an Image/Link to download the presentation.
The content on the website is provided AS IS for your information and personal use only. It may not be sold, licensed, or shared on other websites without obtaining consent from the author.If you encounter any issues during the download, it is possible that the publisher has removed the file from their server.
You are allowed to download the files provided on this website for personal or commercial use, subject to the condition that they are used lawfully. All files are the property of their respective owners.
The content on the website is provided AS IS for your information and personal use only. It may not be sold, licensed, or shared on other websites without obtaining consent from the author.
E N D
Presentation Transcript
Agenda Market overview Detariff Cycle & its evolution Need for burning cost & its introduction Challenges & next step GHI burning cost Way forward 2
De tariff cycle - learning from other markets Phase III Phase I Phase II Market Forces Collaborations Triggers M&As Capacity difficult to come by Rational Behavior Return of growth Price War Pressure on cost Adequacy of Sum Insured Coverage enhancement Induced Behavior Return of growth Regulatory Intervention Re tariff Capital infusion Restriction on entry of new players Value destruction Companies go down under 3
China Evolution of Distribution, Regulation & Pricing 6 Years 2003 2006 1H 2006 2H - 2008 2012+ To 2002 2009-2011 Sales Staff, Agency, Call Center, Cross Sell Sales Staff, Agency Sales Staff, Agency Sales Staff, Agency, Call Center, Cross Sell Distribution Sales Staff Tariff, Strengthened Market Practice Guideline Rate Regulation Tariff File and use Tariff Tariff Reform GLM and more advanced risk classification gain momentum Some Insurers successfully adopted GLM Pricing Technology Basic Risk Segmentation Deep Discount from previous tariff price offered by many insurers. Regulators concerned by increased solvency risk Stiff Tariff-market but it is moving towards detariffication again 4
Historical underwriting results of Chinese local market Indian GI Industry Combined Ratio 500000 126% 120% 119% 462,238 114% 117% 110% 110.0% 450000 108.2% 109.4% 402,689 400000 Millions RMB 104.3% 103.5% 350000 105.0% 299,290 300000 244,625 97.7% 250000 98.2% 100.0% 208,648 200000 96.7% 158,035 150000 128,111 95.0% 100000 50000 90.0% 0 2005 2006 2007 2008 2009 2010 2011 Combined Ratio GWP Data Resource: CIRC, China Insurance YearBook, Annual Statements for P&C insurers, Towers Watson Data are for all domestic P&C insurers combines. 5
Japan Combined Ratio 115% Mergers and Acquisitions 110% 105% 100% 95% 90% Market agreement between market players to control price 85% 80% 1996 1997 1988 1999 2000 2001 2002 2003 2004 2005 2006 Detarrification in 1998 Massive erosion in premium Triggers consolidation Large agents close down Gives rise to increase in solicitors 6
Agenda Detariff Cycle & its evolution Importance of reserves Need for burning cost & its introduction Challenges & next step GHI burning cost Way forward 7
Global Property Market Scenario: Pricing and Market Capacities Gross Premium and Capacity in INR Mn Gross Property Premium , Capacity 0.5 India 73,000 in the domestic market and 60,000 0.5 24,540 Singapore Average rates are being compared 1 Brazil 54,000 150,000 for Indian Market Context with 1.5 South Africa Southeast Asian Market , African 44,400 99,750 Saudi Arabia Market and Middle east market 11,400 1.2 19,080 23,160 Domestic Capacity Gross Written Premium Rate( Per Mille) Capacity of Indian market is higher than the Southeast Asian, African and Middle East counterparts Higher domestic capacity in the market lead to high competition thereby having an adverse impact on the Pricing Source: www. axco.co.uk Country specific Insurance market research papers Period: 2010-11 to 2012-13 8
Loss Ratio : Industry trend Industry Net LR 106% 96% 97% 94% 100% 111% 107% Health Marine Fire 103% 83% Engineering 78% 90% 87% 66% 65% 77% 93% 86% 90% 81% 88% 69% 73% 59% 56% 54% 53% 40% 37% 2007-08 2008-09 2009-10 2010-11 2011-12 2012-13 2013-14 I. Loss ratio s across products are consistently on an higher side for major products in General Insurance Industry No benchmark data available for pricing the risk II. Source: IRDA published Numbers Period: 2007-08 to 2013-14 9
Regulator Intervention on Price Burning Cost to be the starting point of Pricing IIB has published the FLEXA burning cost of 89 Occupancy Insurer can calculate their own burning cost from their past acceptance Insurer can use lower of the two for FLEXA rating Burning rate has to loaded for acquisition, management cost and CAT cost Risk accepted at the rate lower than the two needs to be report to the Board of the company . 10
IIB Approach to Burning rates All premium and claims data for FY 12, FY 13 and FY 14 considered. out of 255 occupancies IIB has provided data for 89 of them In claim data, only Non AOG losses considered for calculation. All losses which are upto 5 Cr (100% of the loss) are being considered as frequency losses losses above 5 Cr ( 100% of the loss) are being termed as large loss The large loss loading % need to be applied on frequency burning rates The overall burning rate = frequency loss burning rate + large loss loading on this rate. 11
Agenda Detariff Cycle & its evolution Need for burning cost & its introduction Indian industry and reserving evolution Challenges & next step GHI burning cost Way forward 12
Challenge with current Burn cost approach Burn rate is currently for 89 occupancies . 40% market is still unaddressed No uniform methodology for calculation of burning rates among companies Inadequacy of claims data with some of the insurance companies Guidance on AOG pricing to be developed 13
Exposure based pricing There is a need to pass on the cost of large loss objectively to the customer The prescribed approach is subjective The load for large losses will depend on: The distribution of large loss for the risk group The risk tolerance of the company RoE 14
Threshold for large loss Separate losses into attritional and large Threshold is estimated separately for each risk band Probability of claims greater than threshold is low Large losses are low frequency-high severity Attritional Large Loss 15
Estimating large loss load Statistical distribution fitted on large claim experience Loss cost is typically simulated as a product of frequency and severity of large loss Load over and above average is defined as a cost of raising capital Extreme loss defined as per risk tolerance of company (say 1 in 20 years (95%VaR)) Cost of raising capital is assumed (say 20%) Large loss load is allocated in risk categories 16
Agenda Detariff Cycle & its evolution Need for burning cost & its introduction Challenges & next step Challenges GHI burning cost Way forward 17
Burning cost for GHI Can industry wide loss cost per life per SI be collated? Demography (Age, Gender) Coverages (say maternity, PED etc) Copay, deductibles and sublimits customized for each risk Location (Tier I, Tier II; spread of lives in Tier I and Tier II) Complex equation; numerous permutation and combination; Per life risk rate not possible 18
Possible approach Segment wise approach One approach will not suit all types of policies Burning cost methodology v/s standard risk rate Rather than quantifying the burning cost, the approach to be adopted need to be agreed upon Policies with GWP >25 Lacs Standard methodology of burning cost to be agreed Factors to be considered to be standardized (IBNR, O/S claims, medical inflation) Policy level LR not to exceed threshold LR (recommended at 90%) incl IBNR Reporting to board for deviation cases Policies with GWP <25 Lacs Portfolio level monitoring 19
Agenda Detariff Cycle & its evolution Need for burning cost & its introduction Challenges & next step GHI burning cost Way forward Way forward 20
Way Forward Pricing Mechanism for industry Moving towards exposure based pricing from current burning cost approaches Research papers on pricing New dimension to price instead of base as tariff Industry exposure curves 21
Thank You 22