Understanding Educational Data Mining Methods and Applications
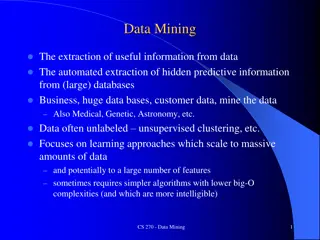
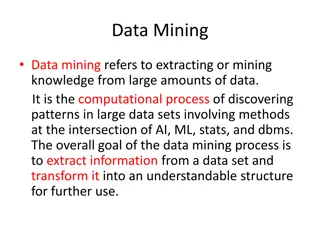
Educational Data Mining (EDM) is an emerging field focused on exploring unique educational data to enhance student understanding and learning environments. This summary covers key aspects of EDM including various methods such as Prediction, Clustering, Relationship Mining, and Discovery with Models.

Download Presentation

Please find below an Image/Link to download the presentation.
The content on the website is provided AS IS for your information and personal use only. It may not be sold, licensed, or shared on other websites without obtaining consent from the author. Download presentation by click this link. If you encounter any issues during the download, it is possible that the publisher has removed the file from their server.
E N D
Presentation Transcript
Educational Data Mining March 3, 2010
Todays Class EDM Assignment#5 Mega-Survey
Educational Data Mining Educational Data Mining is an emerging discipline, concerned with developing methods for exploring the unique types of data that come from educational settings, and using those methods to better understand students, and the settings which they learn in. www.educationaldatamining.org
Classes of EDM Method (Romero & Ventura, 2007) Information Visualization Web mining Clustering, Classification, Outlier Detection Association Rule Mining/Sequential Pattern Mining Text Mining
Classes of EDM Method (Baker & Yacef, 2009) Prediction Clustering Relationship Mining Discovery with Models Distillation of Data For Human Judgment
Prediction Develop a model which can infer a single aspect of the data (predicted variable) from some combination of other aspects of the data (predictor variables) Which students are using CVS? Which students will fail the class?
Clustering Find points that naturally group together, splitting full data set into set of clusters Usually used when nothing is known about the structure of the data What behaviors are prominent in domain? What are the main groups of students?
Relationship Mining Discover relationships between variables in a data set with many variables Association rule mining Correlation mining Sequential pattern mining Causal data mining Beck & Mostow (2008) article is a great example of this
Discovery with Models Pre-existing model (developed with EDM prediction methods or clustering or knowledge engineering) Applied to data and used as a component in another analysis
Distillation of Data for Human Judgment Making complex data understandable by humans to leverage their judgment Text replays are a simple example of this
Focus of todays class Prediction Clustering Relationship Mining Discovery with Models Distillation of Data For Human Judgment There will be a term-long class on this, taught by Joe Beck, in coordination with Carolina Ruiz s Data Mining class, in a future year Strongly recommended
Prediction Pretty much what it says A student is using a tutor right now. Is he gaming the system or not? A student has used the tutor for the last half hour. How likely is it that she knows the knowledge component in the next step? A student has completed three years of high school. What will be her score on the SAT-Math exam?
Two Key Types of Prediction This slide adapted from slide by Andrew W. Moore, Google http://www.cs.cmu.edu/~awm/tutorials
Classification General Idea Canonical Methods Assessment Ways to do assessment wrong
Classification There is something you want to predict ( the label ) The thing you want to predict is categorical The answer is one of a set of categories, not a number CORRECT/WRONG (sometimes expressed as 0,1) HELP REQUEST/WORKED EXAMPLE REQUEST/ATTEMPT TO SOLVE WILL DROP OUT/WON T DROP OUT WILL SELECT PROBLEM A,B,C,D,E,F, or G
Classification Associated with each label are a set of features , which maybe you can use to predict the label Skill ENTERINGGIVEN ENTERINGGIVEN USEDIFFNUM ENTERINGGIVEN REMOVECOEFF REMOVECOEFF USEDIFFNUM . pknow 0.704 0.502 0.049 0.967 0.792 0.792 0.073 time 9 10 6 7 16 13 5 totalactions 1 2 1 3 1 2 2 right WRONG RIGHT WRONG RIGHT WRONG RIGHT RIGHT
Classification The basic idea of a classifier is to determine which features, in which combination, can predict the label Skill ENTERINGGIVEN ENTERINGGIVEN USEDIFFNUM ENTERINGGIVEN REMOVECOEFF REMOVECOEFF USEDIFFNUM . pknow 0.704 0.502 0.049 0.967 0.792 0.792 0.073 time 9 10 6 7 16 13 5 totalactions 1 2 1 3 1 2 2 right WRONG RIGHT WRONG RIGHT WRONG RIGHT RIGHT
Classification Of course, usually there are more than 4 features And more than 7 actions/data points I ve recently done analyses with 800,000 student actions, and 26 features
Classification Of course, usually there are more than 4 features And more than 7 actions/data points I ve recently done analyses with 800,000 student actions, and 26 features 5 years ago that would ve been a lot of data These days, in the EDM world, it s just a medium-sized data set
Classification One way to classify is with a Decision Tree (like J48) PKNOW <0.5 >=0.5 TIME TOTALACTIONS <6s. >=6s. <4 >=4 RIGHT WRONG RIGHT WRONG
Classification One way to classify is with a Decision Tree (like J48) PKNOW <0.5 >=0.5 TIME TOTALACTIONS <6s. >=6s. <4 >=4 RIGHT WRONG RIGHT WRONG Skill COMPUTESLOPE pknow 0.544 time 9 totalactions 1 right ?
Classification Another way to classify is with step regression Linear regression (discussed later), with a cut- off
And of course There are lots of other classification algorithms you can use... SMO (support vector machine) In your favorite Machine Learning package
And of course There are lots of other classification algorithms you can use... SMO (support vector machine) In your favorite Machine Learning package WEKA
And of course There are lots of other classification algorithms you can use... SMO (support vector machine) In your favorite Machine Learning package WEKA RapidMiner
And of course There are lots of other classification algorithms you can use... SMO (support vector machine) In your favorite Machine Learning package WEKA RapidMiner KEEL
And of course There are lots of other classification algorithms you can use... SMO (support vector machine) In your favorite Machine Learning package WEKA RapidMiner KEEL RapidMiner
And of course There are lots of other classification algorithms you can use... SMO (support vector machine) In your favorite Machine Learning package WEKA RapidMiner KEEL RapidMiner RapidMiner
And of course There are lots of other classification algorithms you can use... SMO (support vector machine) In your favorite Machine Learning package WEKA RapidMiner KEEL RapidMiner RapidMiner RapidMiner
How can you tell if a classifier is any good?
How can you tell if a classifier is any good? What about accuracy? # correct classifications total number of classifications 9200 actions were classified correctly, out of 10000 actions = 92% accuracy, and we declare victory.
Biased training set What if the underlying distribution that you were trying to predict was: 9200 correct actions, 800 wrong actions And your model predicts that every action is correct Your model will have an accuracy of 92% Is the model actually any good?
What are some alternate metrics you could use?
What are some alternate metrics you could use? Kappa (Accuracy Expected Accuracy) (1 Expected Accuracy)
What are some alternate metrics you could use? A The probability that if the model is given an example from each category, it will accurately identify which is which
Comparison Kappa easier to compute works for an unlimited number of categories wacky behavior when things are worse than chance difficult to compare two kappas in different data sets (K=0.6 is not always better than K=0.5)
Comparison A more difficult to compute only works for two categories (without complicated extensions) meaning is invariant across data sets (A =0.6 is always better than A =0.55) very easy to interpret statistically
What data set should you generally test on? A vote Raise your hands as many times as you like
What data set should you generally test on? The data set you trained your classifier on A data set from a different tutor Split your data set in half (by students), train on one half, test on the other half Split your data set in ten (by actions). Train on each set of 9 sets, test on the tenth. Do this ten times. Votes?
What data set should you generally test on? The data set you trained your classifier on A data set from a different tutor Split your data set in half (by students), train on one half, test on the other half Split your data set in ten (by actions). Train on each set of 9 sets, test on the tenth. Do this ten times. What are the benefits and drawbacks of each?
The dangerous one (though still sometimes OK) The data set you trained your classifier on If you do this, there is serious danger of over- fitting
The dangerous one (though still sometimes OK) You have ten thousand data points. You fit a parameter for each data point. If data point 1, RIGHT. If data point 78, WRONG Your accuracy is 100% Your kappa is 1 Your model will neither work on new data, nor will it tell you anything.
The dangerous one (though still sometimes OK) The data set you trained your classifier on When might this one still be OK?
K-fold cross validation (standard) Split your data set in ten (by action). Train on each set of 9 sets, test on the tenth. Do this ten times. What can you infer from this?
K-fold cross validation (standard) Split your data set in ten (by action). Train on each set of 9 sets, test on the tenth. Do this ten times. What can you infer from this? Your detector will work with new data from the same students
K-fold cross validation (student-level) Split your data set in half (by student), train on one half, test on the other half What can you infer from this?
K-fold cross validation (student-level) Split your data set in half (by student), train on one half, test on the other half What can you infer from this? Your detector will work with data from new students from the same population (whatever it was)


")
")
")
")