Graphing Polar Equations: Examples and Symmetry Tests

Explore examples of graphing polar equations like r = 3, r = 4sin(θ), and more. Learn how to identify and graph such equations, along with tests for symmetry in polar graphs. Understand the relationship between polar axis, lines, and the pole in polar coordinate systems.

Download Presentation

Please find below an Image/Link to download the presentation.
The content on the website is provided AS IS for your information and personal use only. It may not be sold, licensed, or shared on other websites without obtaining consent from the author. Download presentation by click this link. If you encounter any issues during the download, it is possible that the publisher has removed the file from their server.
E N D
Presentation Transcript
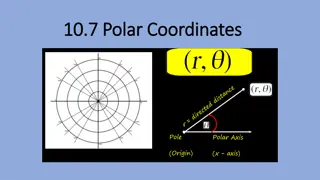
8.2 - Graphing Polar Equations
Ex.4 graph r sin = 2 in polar form on your calculators. 1. Press mode change to polar function, and into degree form. 2. Press window and change to the following window settings: min = 0 max = 360 step = 15 x min = -5 x max = 5 x scl = 1 y min = -1 y max = 4 y scl = 1 Press y = and enter all equations in r = form. If you are entering a polar equation into the calculator you have to solve for r first. Press graph
Let a be a nonzero real number: 1. r sin = a This is a horizontal line a units above the pole if a > 0, and |a| units below the pole if a < 0. 2. r cos = a This is a vertical line a units to the right of the pole if a > 0, and |a| units to the left of the pole if a < 0.
Tests for Symmetry Test are sufficient, but not necessary. NO means MAYBE. YES means YES. In each test, if an equivalent equation results, then the answer is YES. Polar axis (like x-axis): replace with (- ) 1. Line = /2 (like y-axis): replace with ( ) 2. With respect to the pole (like the origin): replace r with (-r) 3.
Ex.8 Test r = -2 cos for symmetry 1. polar axis : r = -2 cos (- ) = -2 cos YES 2. = /2 : r = -2 cos ( ) = -2 [cos cos + sin sin ] -2 [- cos ] NO 3. With respect to the pole : -r = - (-2 cos ) = 2 cos NO
Using Symmetry to Sketch Ex.9 Graph r = 3 + 2cos Replacing (r, ) with (r,- ) produces: r = 3 + 2cos(- ) = 3 + 2cos The graph is symmetric with respect to the polar axis, and you need only plot points from 0 to . Lima on r 0 5 3+ /6 3 /3 4 /2 3 2 /3 2 2 3- 5 /6 3 1 1
Summary of Special Polar Graphs Limacons: = = r r a a b b b cos sin 0 ( ) a 0, a b a b a b 1 a b= 1 2 2 1 Convex Limacon Limacon with inner loop Cardioid (heart-shaped) Dimpled Limacon |? a < b a = b a > b ?| 2
Rose Curves: b petals if is odd 2 petals if is even 2 b b b b ( ) = b = b = b r a cos r a cos r a sin = b r a sin a determines the length of the petal, and b determines the number of petals.
Circles and Lemniscates Circles Lemniscates = = r a cos r a sin = = 2 2sin2 2 2cos2 r a r a