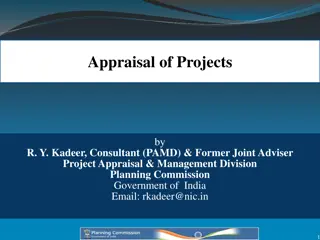
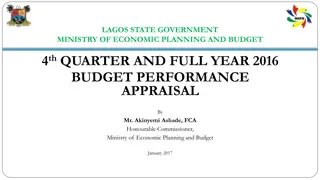
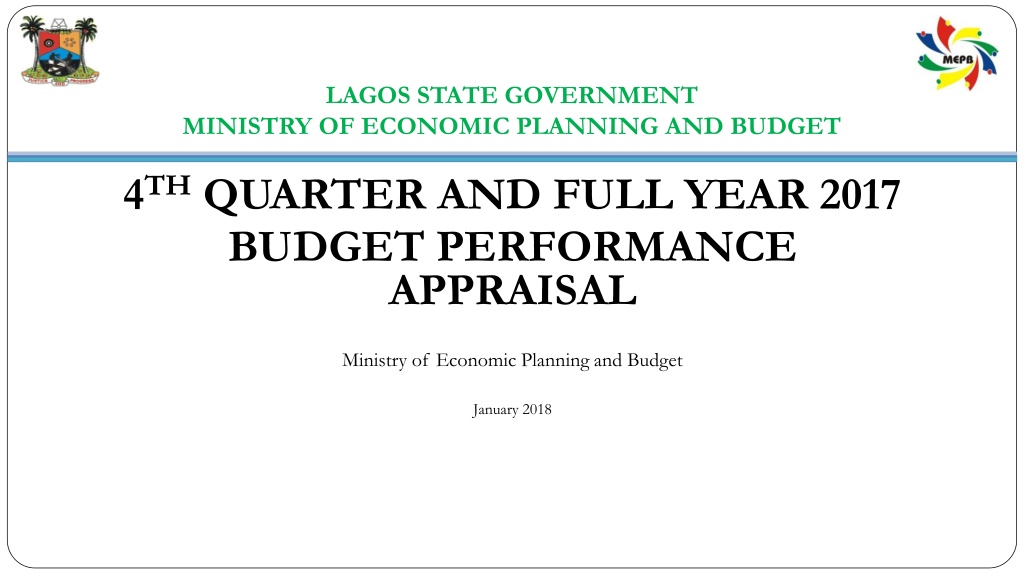
Lagos State Government Ministry of Economic Planning and Budget 2017 Budget Performance Appraisal
The presentation reviews the performance of Lagos State Government's economic planning and budget for the 4th quarter and full year of 2017. It includes an overview of the budget, key focus areas, implementation strategies, revenue and expenditure appraisals, comparative analysis, observations, and recommendations. The approved 2017 budget details allocations for various function groups and projected revenue sources. The goal is to ensure efficient utilization of funds to support the state's vision as a leading economic and financial hub in Africa.

Download Presentation

Please find below an Image/Link to download the presentation.
The content on the website is provided AS IS for your information and personal use only. It may not be sold, licensed, or shared on other websites without obtaining consent from the author. Download presentation by click this link. If you encounter any issues during the download, it is possible that the publisher has removed the file from their server.
E N D
Presentation Transcript
LAGOS STATE GOVERNMENT MINISTRY OF ECONOMIC PLANNING AND BUDGET 4THQUARTER AND FULL YEAR 2017 BUDGET PERFORMANCE APPRAISAL Ministry of Economic Planning and Budget January 2018 4th Quarter & Full Year 2016 Budget Performance Appraisal
Outline Purpose of the Presentation 2017 Budget Overview 2017 Budget Focus and Priorities 2017 Key Implementation Strategies Review of Q1 2017 Performance Review of Q2 2017 Performance Review of Q3 2017 Performance Highlights of Cumulative Budget Performance Review (Jan. Dec. 2017) Revenue Appraisal Expenditure Appraisal Comparative Analysis Observations and Recommendations Summary/Conclusion(s) Annexures 2 2 4th Quarter & Full Year 2016 Budget Performance Appraisal
2017 Approved Budget Overview 33 4th Quarter & Full Year 2016 Budget Performance Appraisal
Approved 2017 Budget Overview 2017 Budget of 812.998bn was signed into law on 9 January 2017. SN Details 2017 Budget ( bn) 1. Total revenue Total recurrent expenditure (debt & non- debt) Recurrent debt Recurrent non-debt a. Personnel cost b. Overhead cost Recurrent surplus Capital expenditure Financing (Surplus)/Deficit a. External loans i. World Bank - DPO ii. Others b. Internal loans Bond issuance Budget size 642.848 The State s Vision and Mission: Vision:Africa s model megacity, a global economic and financial hub that is safe, secure, functional and productive. Mission: Eradicate poverty and promote economic growth through infrastructure renewal and development. 2. 305.182 30.078 275.104 104.712 170.393 337.666 507.817 170.151 22.551 3. 4. 5. - 22.551 47.600 100.000 812.998 6. 7. 4 4th Quarter & Full Year 2016 Budget Performance Appraisal
Approved 2017 Budget Details of Function Group Allocation Recurrent Capital bn Total bn Allocation Function group bn % General public service 133.744 73.410 207.155 25.48 Public order and safety 18.047 21.674 39.722 4.89 Economic affairs 38.887 257.830 296.717 36.50 Environmental protection 114.249 42.319 56.569 6.96 Housing & community amenities 2.886 47.458 50.344 6.19 Health 34.557 16.870 51.447 6.33 Recreation, culture & religion 2.552 9.867 12.419 1.53 Education 58.118 34.327 92.445 11.37 Social protection 2.122 4.058 6.180 0.76 Total 305.182 507.816 812.998 100.00 5 5 4th Quarter & Full Year 2016 Budget Performance Appraisal
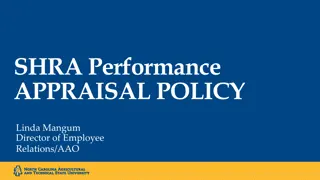
Approved 2017 Budget Projected Revenue Sources and Capital to Recurrent Ratio Capital / Recurrent Ratio Projected Revenue Sources Federal Transfers 28% Recurrent, 42% Capital, 58% Capital Receipt 2% IGR 70% 6 4th Quarter & Full Year 2016 Budget Performance Appraisal
Approved 2017 Budget Focus Security Transportation Economy (including agriculture & tourism) Power Housing Infrastructure (road) Education Health Environment Water Rural/Urban Development Skill Acquisition/Microfinance e-Governance Enhanced capacity building 7 4th Quarter & Full Year 2016 Budget Performance Appraisal
Approved 2017 Budget Key Implementation Strategies Benchmark performance set at 100% Bi-weekly Revenue Stakeholders meeting as a vehicle for sustained revenue drive Central billing, revenue automation, multi-channels revenue payment Quarterly budget performance appraisal Tighter operational expenditure control Strict adherence to the 2017 Budget Operational Guidelines Continuous Implementation of Treasury Single Account (TSA) More effective and efficient project monitoring and evaluation Maintenance of Capital to Recurrent ratio of 41 : 59 8 4th Quarter & Full Year 2016 Budget Performance Appraisal
Highlights of Budget Performance Review 9 4th Quarter & Full Year 2016 Budget Performance Appraisal
Q1 to Q4 2017 Budget Performance Review Comparative Analysis from Q1 to Q4 (1/2) Details Q4 2017 Q3 2017 Q2 2017 Q1 Y2017 Prov. Oct. Dec. Actual Oct.- Dec. Prov. Jul. Sept. Actual Jul- Sept. Prov. Jan. Mar. Actual Jan. Mar. Prov. Apr.- June Actual Perf. % Perf. % Perf. % Perf. % Total Revenue (a) 160.712 151.888 95 160.712 123.116 77 160.712 117.292 73 160.712 124.141 77 Total Capital Receipts (b) 6.36 7.005 110 6.36 4.217 66 6.36 4.665 73 6.36 3.902 61 Recurrent expenditure (debt & non-debt) (c) = (d) + (e) + (f) 76.296 76.622 100 76.296 85.881 113 76.296 75.847 99 76.296 73.464 96 a. Recurrent debt (d) 7.520 5.665 75 7.52 5.158 69 7.52 5.565 74 7.52 5.585 74 b. Recurrent non-debt 68.776 70.957 103 68.776 80.724 117 68.776 70.283 102 68.776 67.878 99 i. Personnel cost (e) 26.178 27.419 105 26.178 26.654 102 26.178 24.909 95 26.178 23.962 92 ii. Overhead cost (f) 42.598 43.539 102 42.598 42.727 100 42.598 26.613 62 42.598 42.579 100 Recurrent Surplus (g) = (a ) ( C ) 84.416 75.266 89 84.416 37.235 44 84.416 41.445 49 84.416 50.677 60 Capital Expenditure (h) 126.954 125.47 99 126.954 116.128 91 126.954 55.563 44 126.954 46.743 37 Financing - (requirement) / Surplus (i) = (g) - (h) -42.538 -50.204 118 -42.537 -78.893 185 -42.537 -6.23 15 -42.537 3.934 -9 Budget Size (j) = (c) + (h) 203.250 202.092 99 203.249 202.01 99 203.249 131.411 65 203.249 120.206 59 10 4th Quarter & Full Year 2016 Budget Performance Appraisal
Q4 2017 Budget Performance Review Comparative Analysis from Q1 to Q4 (2/2) Q4 Y2017 performance was 202.092bn/99% compare to Q3 202.010bn/99%, Q2 131.411bn/65% and 120.206bn/59% for Q1. The Overhead Cost performed at 43.539bn/102% compare to Q3 42.727bn/100%, 26.613bn/62% in Q2 and 42.579bn/100% in Q1 Capital Expenditure performance was 125.470bn/99% compare to 116.128bn/91% in Q3, 55.563bn/44% in Q2 and 46.743bn/37% in Q1. Total Revenue (TR) recorded 151.888bn/95% against 123.116bn/77% in Q3, 117.292bn/73% in Q2 and lower than 124.141bn/77% % in Q1 by 0.175bn in absolute terms. 4th Quarter & Full Year 2016 Budget Performance Appraisal
Q4 2017 Budget Performance Review Comparative Analysis from 2015 to 2017 The Budget performance for Q4 2017 was 99% compared to 113% in Q4 2016 and 91% in 2015. Capex was 99% in Q4 2017 compared to 122 % in Q4 2016 and 99% in 2015. Details 2017 Actual Oct.- Dec. 2016 2015 Prov. Oct.- Dec. Prov. Oct.- Dec. Actual Oct.- Dec. Prov. Oct.- Dec. Perf % Perf % Actual Oct.-Dec. Perf % bn Total Revenue (a) 135.719 132.166 97 122.423 98.546 80 160.712 151.888 95 5.244 3.254 Total Capital Receipts (b) 8.585 12.663 147 62 6.36 7.005 110 Recurrent expenditure (debt & non-debt) (c) = (d) + (e) + (f) 64.561 63.585 98 0 0 0 76.296 7.520 68.776 76.622 5.665 70.957 100 75 103 a. Recurrent debt (d) b. Recurrent non-debt 3.288 61.273 4.812 58.772 146 96 0 0 0 83 86 60.494 28.325 50.330 24.238 i. Personnel cost (e) 25.552 25.043 98 26.178 27.419 105 32.169 26.092 81 ii. Overhead cost (f) 35.721 33.729 94 42.598 43.539 102 Recurrent Surplus (g) 71.158 68.581 96 61.928 48.216 78 84.416 75.266 89 Capital Expenditure (h) 101.087 122.841 122 61.928 61.576 99 126.954 125.47 99 Financing - (requirement) / Surplus (i) = (g) - (h) Budget Size (j) = (c) + (h) - (13.359) - (29.929) (54.260) 181 -42.538 -50.204 118 165.647 186.426 113 122.423 111.906 91 203.250 202.092 99 12 4th Quarter & Full Year 2016 Budget Performance Appraisal
Comparative Analysis of Cumulative (Jan. - Dec.) Budget Performance for Y2016 to Y2017 Details Y2017 Y2016 Prov. Actual Perf % Prov. Actual Perf % N bn Jan. - Dec. Jan. - Dec. Jan. - Dec. Jan. - Dec. Total revenue (a) 514.405 80 436.328 80 642.848 542.874 Total capital receipts (b) 15.949 63 21.582 63 25.441 34.341 Recurrent expenditure (debt & non-debt) (c) = (d) + (e) + (f) 281.333 92 237.932 92 305.182 258.242 a. Recurrent debt (d) b. Recurrent non-debt i. Personnel cost (e) ii. Overhead cost (f) 22.694 258.639 103.184 155.455 75 94 99 91 17.261 220.671 96.037 124.634 131 90 94 87 30.078 275.104 104.712 170.393 13.151 245.091 102.209 142.882 Recurrent surplus (g) =(a)-(c) 233.072 69 177.917 63 337.666 284.632 Capital expenditure (h) 387.596 76 290.731 72 507.817 404.347 Financing requirement (deficit)/surplus (i) = (g) (h) 154.524 91 92.336 77 170.151 119.714 Budget size (j) = (c) +(h) 668.929 82 528.664 80 812.998 662.588 13 4th Quarter & Full Year 2016 Budget Performance Appraisal
Full Year Revenue Appraisal 4th Quarter & Full Year 2016 Budget Performance Appraisal
Full Year 2017 Revenue Appraisal (1/6) Provision Actual Performance % Details (Jan. Dec. 2017) (Jan. Dec. 2017) N bn 642.848 476.309 450.867 360.000 62.745 23.722 3.200 1.200 25.441 166.539 48.813 84.899 31.957 N bn 514.405 372.625 356.676 284.642 44.932 17.908 9.194 Total Revenue (A+B+C) Total Internally Generated Revenue (A+B) A. Internally Generated Revenue I. Lagos State Internal Revenue Services (LIRS) II. Internally Generated Revenue (Others) III. Dedicated Revenue IV. Investment Income V. Extra Ordinary Revenue B. Capital Receipts C. Federal Transfers I. Statutory Allocation II. Value Added Tax 80 78 79 79 72 75 287 0 63 85 89 95 57 0 15.949 141.780 42.993 80.232 18.358 III. Extra Ordinary Revenue IV. 13% Derivation 1.500 0.197 13 15 4th Quarter & Full Year 2016 Budget Performance Appraisal
Full Year 2017 Revenue Appraisal (2/6) % of Actual Performance Federal Transfers 28% Capital Receipt 3% IGR 69% 16 4th Quarter & Full Year 2016 Budget Performance Appraisal
Full Year 2017 Revenue Appraisal(3/6) Total Revenue ( TR ) performed at 514.405bn/80% of target compared to N436.328bn/80% in Y2016; 78.077bn more in absolute terms due to ongoing reforms in revenue collection. Total Revenue Total Internally Generated Revenue ( TIGR ) was 372.625bn/77%, against 312.830bn/75% in Y2016 and represents 72.44% of TR. Total IGR Dedicated Revenue amounted to 17.908bn/75%, which is equivalent to 4.81% of TIGR and 3.48% of the TR. Dedicated Revenue LIRS performance of 284.642bn/79% accounted for 76.38% of the TIGR and 55.33% of the TR, compared to N247.022bn/82%; 79% of the TIGR and 57% in Y2016 which is more in absolute terms. LIRS Capital Receipts Capital receipts performed at 15.949bn/63%, 4.28% of TIGR and 3.10% of TR respectively. Federal transfers contributed 141.780bn/85%; 27.56% of the TR; Statutory Allocation (SA) contributed 42.993bn/89%, while VAT performed at 80.232bn/95% of provision. Federal Transfers 17 4th Quarter & Full Year 2016 Budget Performance Appraisal
Full Year 2017 Revenue Appraisal(4/6) % of Actual vs. Provisional Performance 85 79 100 63 80 60 40 20 0 Internally Generated Revenue 79 Capital Receipts 63 Federal Transfers 85 18 4th Quarter & Full Year 2016 Budget Performance Appraisal
Full Year 2017 Revenue Appraisal(5/6) Contribution of Revenue to the State Internally Generated revenue 450,867 Capital Recipts Federal Reserve Prov. 25,441 166,539 Actual 356,676 15,949 141,780 19 4th Quarter & Full Year 2016 Budget Performance Appraisal
Full Year 2017 Revenue Review for 2015 2017 (6/6) Comparative Analysis of Total Revenue (Y2015-2017) 514.405 436.328 600 339.382 500 400 300 200 100 0 Y2017 514.405 Y2016 436.328 Y2015 339.382 Series1 20 4th Quarter & Full Year 2016 Budget Performance Appraisal
Full Year 2017 Revenue Review Comparative Analysis of Monthly IGR for 2015 2017 50 40 30 20 10 0 January 33.067 February 31.508 March 30.31 April 27.456 May 31.371 June 28.348 July 25.02 August 28.674 September 27.839 October 27.758 November 38.011 December 43.264 Y2017 Y2016 27.802 26.626 21.627 27.643 22.244 25.487 21.649 23.252 26.628 39.591 32.055 38.334 Y2015 25.243 21.582 23.697 24.058 20.217 23.06 20.591 20.437 28.039 19.516 21.779 24.345 21 4th Quarter & Full Year 2016 Budget Performance Appraisal
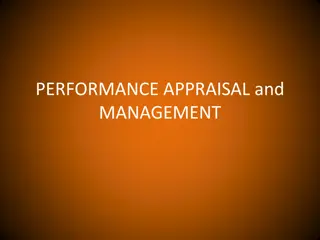
CRF-CUM -PERFORMANCE OF KEY MDAS AS AT DECEMBER, 2017 (Above 500 M) 1/3 CUM. Estimate (Nbn) CUM. Actual (Nbn) SN 1 MDA Lagos State Building Control Authority(LABCA) % Perf 0.500 0.801 160 2 Lagos State Examination Board 0.800 0.710 89 3 Lagos State High Courts 2.695 2.491 92 4 Office of the Surveyor-General 1.400 1.184 85 5 Ministry of Finance 8.020 5.219 65 6 Ministry of Transportation 2.750 1.800 65 7 Lagos State Physical Planning Permit Authority(LASPPPA) 6.529 4.607 71 8 L/S Public Procurement Agency 2.200 1.456 66 22 4th Quarter & Full Year 2016 Budget Performance Appraisal Source:-Monthly Revenue Returns from MDAs
CRF-CUM -PERFORMANCE OF KEY MDAS AS AT DECEMBER, 2017 (Above 500 M) 2/3 CUM. Estimate (Nbn) CUM. Actual (Nbn) SN 9 MDA % Perf Ministry of Education 0.596 0.387 65 10 Lagos State Infrastructural Maintenance& Regulatory Agency (LASIMRA) Motor Vehicle Administration Agency 1.250 0.665 53 11 5.884 3.862 66 12 Lands Bureau 16.500 10.148 62 13 Ministry of Health 0.584 0.233 40 14 State Treasury Office 0.500 0.167 33 15 Lagos State Lotteries Board 0.151 19 0.845 16 Ministry of Waterfront Infrastructure Development 2.311 0.393 17 Source:-Monthly Revenue Returns from MDAs 23 4th Quarter & Full Year 2016 Budget Performance Appraisal
GRAPHICAL ILLUSTRATION OF CRF-CUM. PERFORMANCE OF KEY MDAS (ABOVE N500M) AS AT DECEMBER, 2017 (3/3) 180 160 160 140 120 100 % 80 92 89 85 60 71 66 66 65 65 61 59 53 40 40 33 20 18 17 0 MDA's 24 4th Quarter & Full Year 2016 Budget Performance Appraisal
Full Year 2017 Capital Receipts Appraisal Provision Actual Performance % Details (Jan. Dec. 2017) (Jan. Dec. 2017) N bn N bn Grants (Donor agencies) 9.880 3.984 40 Other capital receipts 15.561 11.965 77 Total capital receipts 25.441 15.949 63 25 4th Quarter & Full Year 2016 Budget Performance Appraisal
Full Year Capital Receipts Performance From Y2015 to Y2017 35 30 25 20 15 10 5 0 Y2015 20.976 Y2016 34.341 Y2017 25.441 Provision Actual 8.1602 21.582 15.949 Provision Actual 4th Quarter & Full Year 2016 Budget Performance Appraisal
Full Year 2017 Expenditure Appraisal 27 4th Quarter & Full Year 2016 Budget Performance Appraisal
Full Year 2017 Personnel Cost Performance Appraisal Total Personnel Cost (TPC) was N103.184bn/99%, recording a decrease of N7.147bn over the same period in Y2016 at N96.037bn/94%. The TPC was 20% of Total Revenue(TR) and 28% of IGR which is within Wage Policy of maximum 25% of TR and 35% of IGR respectively. Provision (Jan. Dec.) Actual Performance % Year (Jan. Dec.) N bn N bn 113.300 98.537 87 2015 102.209 96.037 94 2016 104.712 103.184 99 2017 28 4th Quarter & Full Year 2016 Budget Performance Appraisal
Full Year Overhead Costs Performance From Y2015 - Y2017 Details Y2017 Y2016 Y2015 Prov. N bn Actual N bn Perf % Prov. N bn Actual N bn Perf % Prov. N bn Actual N bn Perf % Total Overhead Costs 170.393 155.455 91 142.882 124.634 87 104.412 103.657 99 Overhead Costs 104.254 103.949 100 87.692 107.674 123 68.705 68.765 100 Dedicated Expenditure 23.722 17.908 75 21.418 0.049 0 19.551 19.08 98 Subvention 42.416 33.598 79 33.772 16.911 50 16.156 15.812 98 Total Overhead Cost performed N155.455bn/91%; representing 55% of the Total Recurrent Expenditure and 44% of IGR compared with N124.634bn/87% which represent 52 % of the Total Recurrent Expenditure and 43% of IGR in 2016. Overhead subventions to Parastatal organizations/tertiary institutions performed at N33.598bn/79% as against N16.911bn/50% in Y2016. Parastatal organizations including tertiary institutions continue to depend on subventions from the State Government, instead of improving on their IGR. 29 4th Quarter & Full Year 2016 Budget Performance Appraisal
Full Year Recurrent Expenditure From Y2015 - Y2017 350 300 250 200 150 100 50 0 Y2015 241.977 Y2016 258.241 Y2017 305.182 Provision Actual 223.003 237.932 281.333 Provision Actual 4th Quarter & Full Year 2016 Budget Performance Appraisal
Capital Expenditure and Financing Activities Appraisal 31 4th Quarter & Full Year 2016 Budget Performance Appraisal
Capital Expenditure: Comparative Full Year Performance From Y2015 - Y2017 Details 2017 2016 2015 Prov. bn Actual bn Perf % Prov. bn Actual bn Perf % Prov. bn Actual bn Perf % Core Capital 394.315 287.978 73 202.360 121.927 60 160.183 50.522 32 Capital Development 15.561 6.965 45 19.188 0.672 4 10.410 0.222 2 Risk Retention Fund 0.107 0 0 0.075 0 0 0.075 0 0 Special Expenditure 7.000 7.301 104 2.562 2.529 99 3.375 3.808 113 Grants from Donor agencies 9.880 3.984 40 6.568 12 0 5.322 3.286 62 Counterpart Fund 6.197 4.046 65 4.571 0 0 5.513 4.608 84 Contingency Reserve 3.099 0 0 0.434 570 131 0.870 1.152 132 Staff Housing Fund External Loans (principal repayments) Internal loans (principal repayments) 0.100 0 0 0.075 0 0 0.038 - - 3.298 6.809 206 1.235 2.718 220 NIL NIL - 23.792 30.133 127 15.000 7.500 50 NIL NIL - Consolidated service account 44.467 40.380 91 38.134 30.863 81 NIL NIL - Total 290.200 166.792 57 185.785 63.598 34 507.816 388.096 76 32 4th Quarter & Full Year 2016 Budget Performance Appraisal
Financing Activities: Comparative Full Year Performance From Y2015 - Y2017 Details Y2017 Y2016 Y2015 Prov. N bn Actual N bn Perf % Prov. N bn Actual N bn Perf % Prov. N bn Actual N bn Perf % Financing Financing (sources) 170.151 154.774 91 119.714 103.794 87 181.636 48.78 54 External loans 22.551 10.527 47 56.416 47.794 85 56.542 14.504 26 i. DPO 0.0 0.0 0.0 40.000 39.526 99 32.000 0 0 ii. Others 22.551 10.527 47 16.416 8.268 50 24.542 14.504 59 Internal loans 47.600 47.000 99 0 0 0 34.276 34.276 100 Bond issue 100.000 97.247 97 63.298 56.000 88 90.818 0.000 0 Repayments 71.557 77.322 108 72.491 57.606 79 1.689 100.469 111 External loans (principal repayments) 3.298 6.809 206 1.646 4.617 281 27.384 1.087 64 Internal loan (principal repayments) 23.792 30.133 127 20.000 9.525 48 61.745 43.492 159 Consolidated debt service accounts 44.467 40.380 91 50.845 43.463 85 32.000 55.889 91 33 4th Quarter & Full Year 2016 Budget Performance Appraisal
Full Year 2017 Capital Expenditure and Financing Activities Appraisal Capital Expenditure Full Y2017 performed at 387.596bn/76% as against 290.731bn/72% in Y2016; 96.865bn more in absolute terms. Financing Activities Full Y2017 showed a net revenue deficit of 154.774bn. The State repaid 77.322bn as debt obligation in Y2017. As at the end of Y2017, the Capital : Recurrent ratio closed at 58:42, against 55:45 as recorded in Y2016. 34 4th Quarter & Full Year 2016 Budget Performance Appraisal
Observations/Recommendations (1/4) 1.0 Revenue: 1.1 The overall Budget performance of 82% requires improvement in view of the 100% target set for the period. 1.2 All MDAs need to ensure 100% performance of their Target in Y2018 to make up for the shortfall in Federal Transfers. 1.3 LIRS performance on a monthly basis though not consistent, improved towards the end of the year and needs to be improved upon to achieve 100% performance in Y2018. 1.4 There is need to intensify efforts by MDAs in shoring up Revenue Performance. 1.5 The LUC needs to ramp up its revenue generating efforts to cover areas that are yet to be enumerated across the State including enforcement activities. 1.6 The full implementation of the Revenue Reform is expected to shoot up Revenue in Y2018. 35 4th Quarter & Full Year 2016 Budget Performance Appraisal
Observations/Recommendations (2/4) 2.0 Recurrent Expenditure: 2.1 Personnel Costs: Personnel Cost performance of N103.184/99% is higher in absolute term compared to N96.037bn/94% in Y2016 but within the World Bank recommended ratios of maximum 25% of TR and 35% of IGR respectively. 2.2 Overhead Expenditure: The Total Overhead Cost performance of N155.455/91% is higher in absolute term compared against N124.634bn/87% in Y2016. 36 4th Quarter & Full Year 2016 Budget Performance Appraisal
Observations/Recommendations (3/4) 3.0 Capital Expenditure: The Total Capital Expenditure at 76% reveals a Capex/Recurrent ratio (58:42), though impressive but requires improvement. We need to increase support for delivery of infrastructure in areas such as road rehabilitation, transportation, security, environment, Housing etc. to drive performance further. MDAs must exhaust proposed capital expenditures within their budgetary provisions before seeking for State Wide Votes from MEPB in Y2018. 37 4th Quarter & Full Year 2016 Budget Performance Appraisal
Observations/Recommendations (4/4) 4.0 Financing: The Bond Issuance as well as Internal Loans enhanced delivery of capital projects. 38 4th Quarter & Full Year 2016 Budget Performance Appraisal
Itesiwaju Ipinle Eko Lo je wa logun! Thank you. Comments, Observations & Questions? 39 4th Quarter & Full Year 2016 Budget Performance Appraisal


 Budget")

")
")
")
")
")
")


")
")
")
")