Global Agricultural Trade and Market Dynamics Analysis
Agricultural trade has significantly increased since 2000, driven by economic growth and advancements in technology. Emerging economies like China and India have gained importance as both importers and exporters, impacting the global trade landscape. South-South agricultural trade has seen substantial growth, with middle- and low-income countries playing a significant role. The resilience of agricultural trade despite sluggish global merchandise trade highlights its importance in the global economy.

Download Presentation

Please find below an Image/Link to download the presentation.
The content on the website is provided AS IS for your information and personal use only. It may not be sold, licensed, or shared on other websites without obtaining consent from the author. Download presentation by click this link. If you encounter any issues during the download, it is possible that the publisher has removed the file from their server.
E N D
Presentation Transcript
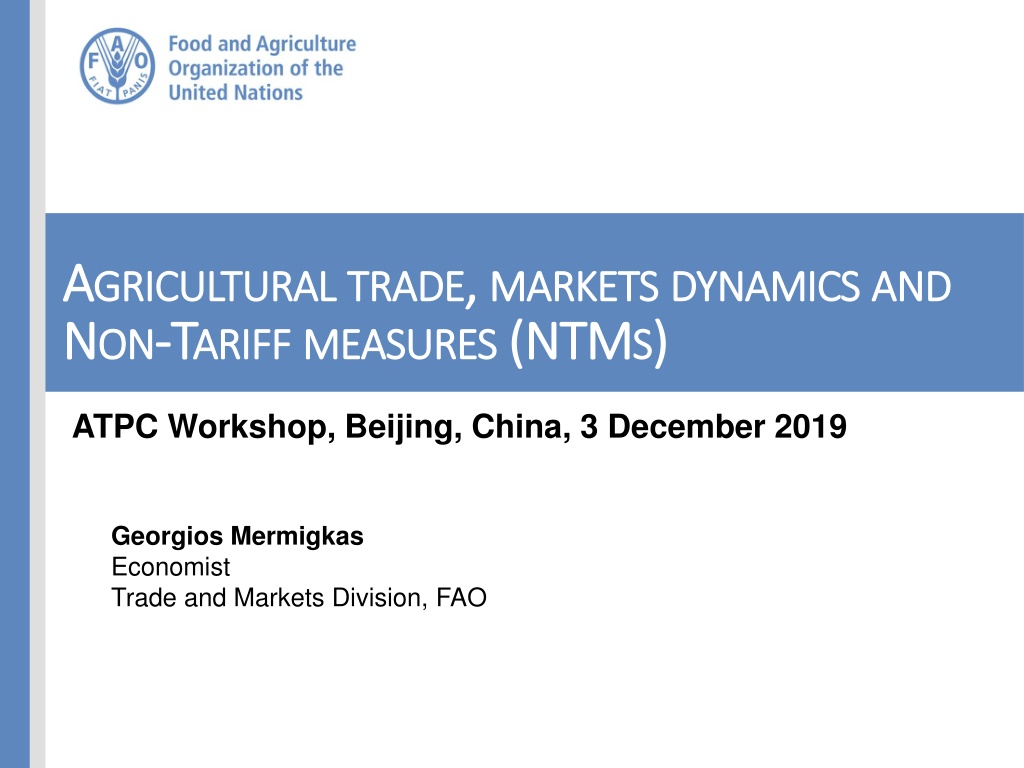
A AGRICULTURAL GRICULTURALTRADE N NON ON- -T TARIFF ARIFFMEASURES TRADE, , MARKETS MARKETSDYNAMICS MEASURES (NTM (NTMS S) ) DYNAMICSAND AND ATPC Workshop, Beijing, China, 3 December 2019 Georgios Mermigkas Economist Trade and Markets Division, FAO 1
WORLDMERCHANDISETRADEAND GDP Annual growth rates, 2000-2016 Agricultural trade increased more than three-fold since 2000 Average annual growth rate of more than 6% Economic growth is the main driver (population, advances in transport and information technology & improvements of Market Access) Since 2008 world merchandise trade has been sluggish due to weak economic growth; agricultural trade has been more resilient SOURCE: FAO calculations using WTO Statistics and World Development Indicators, (World Bank). Agricultural trade comprises products covered by the Agreement on Agriculture, Annex 1 2
INCREASINGIMPORTANCEOFEMERGINGECONOMIES Major importers of agricultural products: share of total import value China s share of world imports increased from 2.3 percent in 2000 to 8.2 percent in 2016 2000 2016 Other emerging economies, such as India, Indonesia, and the Russian Federation increased their aggregate share in global imports from 3.4 percent to 5.2 percent Developed economies such as the EU and Japan experienced a decline in their share of total global import value SOURCE: FAO calculations using data from World Integrated Trade Solution (accessed February 2018). Agricultural trade comprises products covered by the Agreement on Agriculture, Annex 1. 3
INCREASINGIMPORTANCEOFEMERGINGECONOMIES Major exporters of agricultural products: share of total export value 2000 2016 China became the fourth most important exporter (share went up from 3 percent to 4.2 percent) Brazil increased its share from 3.2 percent in 2000 to 5.7 percent in 2016 Traditional exporters such as the EU and the US remain at the top of the ranking but with declined shares SOURCE: FAO calculations using data from World Integrated Trade Solution (accessed February 2018). Agricultural trade comprises products covered by the Agreement on Agriculture, Annex 1. 4
SOUTH-SOUTHAGRICULTURALTRADE Evolution of South-South agricultural trade, 2000-2015 Share of South-South imports increased from 41.9 percent in 2000 to 54.4 percent in 2015 Similar trend for South-South exports. By 2015, about half of the exports of middle- and low-income countries were destined for other South countries SOURCE: FAO calculations using data from World Integrated Trade Solution (accessed February 2018). South countries comprise the World Bank country groups of middle- and low-income countries and non-WTO countries. Agricultural trade comprises products covered by the Agreement on Agriculture, Annex 1.
AGRICULTURALTARIFFS Average agricultural applied tariffs, weighted average (%), 2000 2016 Average applied tariffs declined as countries as a result of bilateral, regional and the WTO trade agreements as well as unilateral policy changes Average hides variation. Usually dairy, rice and sugar are the most protected sectors SOURCE: FAO calculations using data from World Integrated Trade Solution (accessed February 2018). Definitions of high- income, and middle- and low-income countries follow the classification of the World Bank. 6
NON TARIFF MEASURES (NTMS) 7
INTRODUCTION Policy measures other than ordinary customs tariffs that can affect international trade by changing quantities, prices or both. DEFINITION of NTMs Governments use NTMs to address public concerns. In particular in agri-food markets: protect human, animal and plant health regulate technical characteristics of products (i.e. labelling, traceability of material) WHY USED? Sanitary and Phytosanitary (SPS): mainly for animal products, fruits, vegetables, fats & oils Total number of NTMs by MAST classification chapter WHAT ARE THE TYPES of NTMs? SPS 29750 TBT 25772 Export-related measures 7804 Quantitive restrictions 6438 Pre-shipment inspections 1784 Price control measures 1453 Technical Barriers to Trade (TBT): for processed food Contingent trade-protective 332 Other 323 0 10000 20000 30000 SOURCE: UNCTAD TRAINS NTMs database, accessed November 25, 2019
TRENDSINTHEUSEOF TARIFFSAND NTMS Tariffs declining while SPS and TBT measures on the rise Average Effectively Applied Tariff of agricultural products in different regions (%) 25 20 15 10 5 0 1996 1997 1998 1999 2000 2001 2002 2003 2004 2005 2006 2007 2008 2009 2010 2011 2012 2013 2014 2015 2016 2017 2018 All countries Latin America - Caribbean SOURCE: Own calculations on the basis of TRAINS data, accessed through WITS. East Asia - Pacific North America Europe - Central Asia Sub-Saharan Africa WTO TBT notifications related to food WTO SPS notifications 2500 100.00% 2000 80.00% 1500 60.00% 1000 40.00% 500 20.00% 0 0.00% 1995 1996 1997 1998 1999 2000 2001 Revisions Addenda/Corrigenda New notifications Percentage of new notifications related to food 2002 2003 2004 2005 2006 2007 2008 2009 2010 2011 2012 2013 2014 2015 2016 SOURCE: WTO Secretariat.
SIGNIFICANCEOF NTMSIN AGRICULTURE - GLOBAL Relative to other sectors, a higher proportion of agri-food trade is subject to NTMs, in terms of both value (coverage) and product scope (frequency) Disaggregated by product group Disaggregated by country income group Within the agri-food sector, NTMs are higher in: developed > developing > LDCs Within the agri-food sector, NTMs are higher in: animal > vegetable > foodstuffs SOURCE: The unseen impact of NTMs: Insights from a new database, UNCTAD and the World Bank, Geneva, 2018.
SIGNIFICANCEOF NTMSIN AGRICULTURE - ASIA Averages mask country differences e.g. while overall, NTMs in agriculture are very high in all three countries, the prevalence of SPS measures is much higher in China compared with Vietnam and Laos NTMs in Agriculture SPS Measures 1 1 0.8 0.8 0.6 0.6 0.4 0.36 0.4 0.4 0.16 0.2 0.15 0.2 0.11 0.08 0 0 China Lao PDR Viet Nam China Viet Nam Lao PDR Frequency Index Coverage Ratio Frequency Index Coverage Ratio SOURCE: UNCTAD TRAINS NTMs database accessed November 25, 2019. 11
COSTOF NTMS GLOBALLY NTMs add costs equivalent to ~20% of the value of agricultural trade (simple avg.) Ad Valorem Equivalents (AVEs) of NTMs The cost of NTMs is equivalent to or greater than double that of tariffs in most agricultural sub-sectors. Tariffs and AVEs of NTMs by economic sector SOURCE: The unseen impact of NTMs: Insights from a new database, UNCTAD and the World Bank, Geneva, 2018.
COSTOF NTMSIN ASIA Even in weighted avg. terms, costs of NTMs are high in Asia. Highest in South and South-West Asia, and by ag. sector, highest on animal products Import-weighted tariffs and AVEs of NTMs imposed by economies, by sub-region Import-weighted tariffs and AVEs of NTMs, by sector SOURCE: Asia Pacific Trade and Investment Report 2019: Navigating NTMs towards sustainable development, UNESCAP and UNCTAD, 2019.
CONCLUDING REMARKS Global trade has increased significantly since the early 2000s and economic growth is the main driver. Developing countries are playing an increasingly important role in international trade and markets. South-south agricultural trade is increasing. Agricultural import tariffs are declining due to bilateral, regional and multilateral (WTO) agreements. At the same time NTMs (in particular SPS and TBT which are more relevant to agriculture) have increased significantly. NTMs are more common feature in agriculture compared to other sectors and are mostly used by developed as opposed to developing and least developed countries. NTMs add costs equivalent to ~20% of the value of agricultural trade. 14
THANK YOU! Trade and Markets Division Contact Georgios.Mermigkas@fao.org 15