Understanding Taxonomies in Sustainable Development
Explore the significance of taxonomies in relation to indicators for sustainable development goals (SDGs) and the EU Taxonomy for sustainable activities. Learn how indicators are defined, their role in evaluating economic and environmental activities, and the importance of a standardized taxonomy for clarity and comparison. Discover insights on the reduction of wilderness areas from 1900 to 2018 and the concept of taxonomy as a classification system for effective data organization and utilization in achieving SDGs.
Download Presentation
Please find below an Image/Link to download the presentation.
The content on the website is provided AS IS for your information and personal use only. It may not be sold, licensed, or shared on other websites without obtaining consent from the author. Download presentation by click this link. If you encounter any issues during the download, it is possible that the publisher has removed the file from their server.

Presentation Transcript
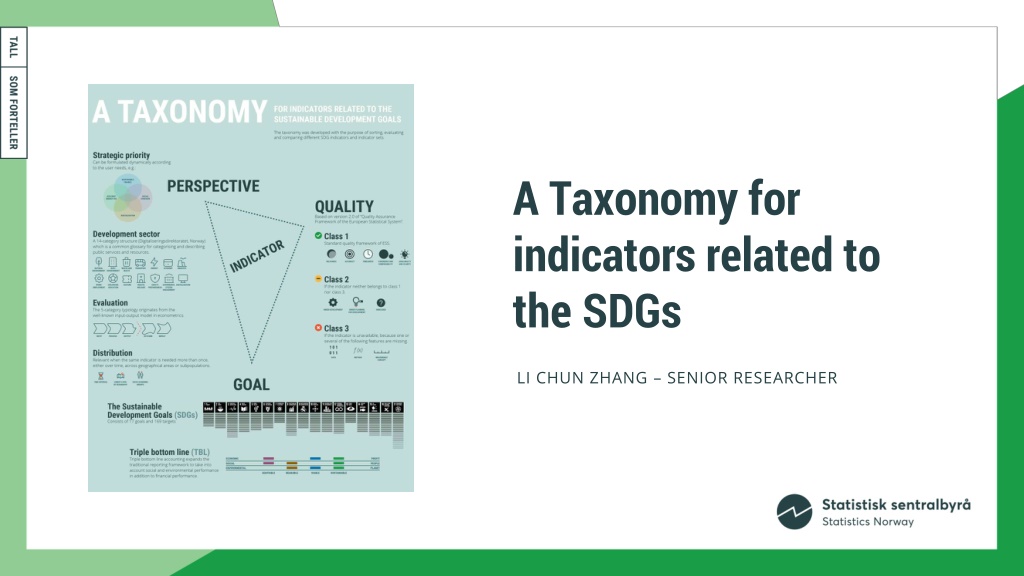
A Taxonomy for indicators related to the SDGs LI CHUN ZHANG SENIOR RESEARCHER
The EU taxonomy for sustainable activities is something else not to be confused (https://ec.europa.eu/sustainable-finance-taxonomy/) What is the EU Taxonomy? The EU Taxonomy is a classification system that helps companies and investors identify environmentally sustainable economic activities to make sustainable investment decisions. Environmentally sustainable economic activities are described as those which make a substantial contribution to at least one of the EU s climate and environmental objectives, while at the same time not significantly harming any of these objectives and meeting minimum safeguards. The EU Taxonomy Navigator offers four tools to help you navigate the EU Taxonomy.
A taxonomy for indicators related to the Sustainable Development Goals (SDGs) The taxonomy is a classification system, which can be used to classify and assess either a given indicator or a set of indicators. Applying a common standard taxonomy to all SDG indicators helps to clarify their use and usability either each on its own or in comparison to others.
How do we define indicator? Generally, an indicator can be understood as a summary representation of a phenomenon or theme area, based on data for a specific time, place and other relevant characteristics. Whereas a statistical indicator is a measurable variable, which is a quantitative summary based on numerical data. E.g. An economic indicator is a statistic about an economic activity (https://en.wikipedia.org/wiki/Economic_indicator) E.g. Environmental indicators are simple measures that tell us what is happening in the environment. (https://en.wikipedia.org/wiki/Environmental_indicator)
A reduction of wilderness areas/villmark more than 5km from heavy technological installations from 1900 to 2018 NRK: Norsk natur forsvinner bit for bit (https://www.nrk.no/klima/slik-forsvinner-norsk-natur-_-bit-for-bit-1.14985837)
Need a taxonomy? Taxonomy: taxis + nomos i.e. classification/category + underlying logic/principle For both contributors and users, naming & describing may be end in itself, e.g. the new plant you found SDG indicators are not meant to be collected but used.
Perspective Data/ Indicator Goal Data owner The conceptual model of the taxonomy Quality Goal (what), Perspective (why), Quality (how useful) Three dimensions, each its own typology , centred on use and usability of an indicator or an indicator set
Strategic priority (dynamic) Development sector (14 categories) Evaluation (5 categories) Distribution (3 categories) Typology 4 types 2 sets 3 classes Perspective SDGs (17 goals., 169 targets) Triple Bottom Line (3 categories) E.g. Strategic priority (dynamic): - Effective energy use - Responsible finance - Social cohesion - Digitalisation Goal Indicator Class 1 (5 categories) Class 2 (3 categories) Class 3 (3 categories) Quality
Distribution Time interval Lowest level of geography (hierarchically structure) Socio-economic groups (inkl. basic demography) Quality (ref. Official Statistics, e.g. ESS Quality Framework) Class 1: can be assessed w.r.t. Relevance, Accuracy, Timeliness, Coherence and comparability, Availability and clarity Class 2, if an indicator neither belongs to class 1 nor class 3 Class 3, unavailable due to missing Data, Method, Measurable concept Important: interplay between Goal , Perspective and Quality Choice or definition of suitable indicator(s) often requires iterations among Goal, Perspective and Quality, which is necessary & essential for achieving the SDGs. The taxonomy helps one to become master of indicators instead of slave of them.
The proposed taxonomy is applicable at any level of aggregation, whether international, national, regional or local. Contents Preface .................................................................................................................................. 3 Abstract ................................................................................................................................. 4 Contents ................................................................................................................................ 5 1.Introduction ..................................................................................................................... 6 1.1. Background ................................................................................................................. 6 1.2. Organisation of the document ..................................................................................... 6 2.A Taxonomy for SDG indicators .................................................................................... 7 2.1. The conceptual model ................................................................................................. 7 2.2. The Taxonomy ............................................................................................................ 8 2.3. Explanation and discussion ......................................................................................... 9 2.4. Questions and answers ............................................................................................. 14 3.Review of the literature ................................................................................................ 17 3.1. Other classification systems ...................................................................................... 17 3.2. Other indicator characteristics in the literature .......................................................... 19 4. Examples of using the taxonomy ................................................................................. 30 4.1 Example 1: Public transport ............................................................................................ 30 4.2 Example 2: Sewage ....................................................................................................... 32 4.3 Example 3. Wind energy ................................................................................................ 33 4.4 Example 4. Dropout from senior high school .................................................................. 34 Accommodate evolvement of user needs, which naturally will occur in the future, by appropriate adjustments of certain elements of the taxonomy, without the need to alter its basic structure.
Thank you sdgstats@ssb.no
UN SDG Ontology: UN SDG Ontology: Connecting SDGs Connecting SDGs- -related Information Resources with Information Resources with Linked Data Linked Data related
metadata.un.org/sdg The UNBIS Thesaurus and the UN Sustainable Development Goals taxonomy are hosted by the Dag Hammarskj ld Library at http://metadata.un.org/sdg Statistics SDG Knowledge
UN SDG Taxonomy System of unique identifiers (URIs) for the SDGs Web-based mechanism to make SDG-related data and information assets accessible, inter- operable and re-usable Similar to how webpages are uniquely identified using URL addresses Enables the development of applications that integrate authoritative data, concepts and definitions from a large number relevant sources on the web. Linked to the UN Bibliographic Information System and other key vocabularies Example: http://metadata.un.org/sdg/1 = Goal 1 http://metadata.un.org/sdg/1.1 = Target 1.1 Statistics SDG Knowledge
Statistical Methods Bringing the SDGs to the semantic web Statistical Classifications Dat a Other vocabularies UN Institutional Knowledge 2030 Agenda Statistic al Data SDG Indicator Framework UN BIS UN SDG Taxonomy VNRs Statistics SDG Knowledge
Target SDG taxonomy dct:subject UNBIS & EuroVoc Concepts dct:subject dct:subject Taxonomy concepts Indicator Goal dct:subject Series Statistics SDG Knowledge
UN SDG taxonomy End poverty in all its forms everywhere @en rdfs:label Sustainable Development Goal 1 - No Poverty @en wd:Q50214636 skos:prefLabel rdfs:label end poverty in all its forms everywhere @en sdgio:SDGIO_00000035 sdg:1 skos:prefLabel unbis:1005064 Poverty @en skos:prefLabel unbis:1005065 Poverty mitigation @en skos:prefLabel ev:2281 Poverty @en Statistics SDG Knowledge
gText application by the UN Department for General Assembly and Conference Management Making GA Resolution Documents machine readable Through an innovative use of artificial intelligence and natural language processing technologies, the Department has developed, under its gText project, an application that automatically converts General Assembly resolutions into XML format, using the Akoma Ntoso for the United Nations (AKN4UN) schema. The application also connects to external systems to retrieve and embed additional metadata into these XML files, such as sponsorship information, voting records and related Sustainable Development Goals, targets and indicators, using unique identifiers from the UN SDG Taxonomy, together with related subjects from the UNBIS Thesaurus and EuroVoc. Statistics SDG Knowledge
Using the taxonomy what can we learn? Examples and findings Geir Graff, KS/Asker municipality
Taxonomy = toolbox Classify Existing SDG-related indicator sets Other indicator sets not originating from the SDGs Own governance indicators Choose Indicators fit-for-purpose according to own materiality assessments or strategic governance needs
Stage 1: Classificaton of SDG- related indicator sets
Initial classification of 6 indicator sets no surprises Suggested National Indicators for Norway
Neither surprising - mostly top quality, national level indicators
BUT some findings DO stand out as interesting Less than we hoped More than we thought
BUT some findings DO stand out as interesting Indicators in some development sectors are underrepresented Development sectors will be similar, but have differences between countries
Examples of usage and collaboration Municipalities and regions use the taxonomy: to find relevant indicators among what is already classified to classify own governance indicators for better strategic choices of indicators Municipalities in The Sustainability Pledge , a cooperation between The Norwegian Association of Local and Regional Authorities (KS), The Confederation of Norwegian Enterprises (NHO) and The Norwegian Confederation of Trade Unions (LO) focus on using the taxonomy to classify own governance indicators A network of the 12 largest municipalities in Norway ( Aggregated governance data for collaborating large municipalities ) pooled 1300 governance indicators and started cooperation on classifying them The taxonomy project has tested using AI to automatically classify certain dimensions
The Sustainability Pledge Indre stfold Municipality The taxonomy helps us move towards more effect- oriented indicators in municipal governance, or at least gives us a greater focus on indicator balance Martin Ludvigsen, Indre stfold municipality Questions? Contact martin.ludvigsen@io.kommune.no
Asker municipality strategical choice of governance indicators 88 indicators 180 discarded indicators 22 potential indicators elected 298 candidates for indicators 8 Indicators no longer in use Questions? Contact Eline.Tonnesson.Tveter@asker.kommune.no Ingvild.Hjortdahl.Becke@asker.kommune.no
Asker municipality - Some similar findings Mostly official statistics More than we thought Mostly class 1
Asker municipality - Qualified choices Focus on update frequency for different kinds of reporting according to planning system Actively looking for effect indicators more than 50% ! Finding gaps need to look for more/better indicators on the area of the elderly
Ontology - visualizing the taxonomy Cooperation with Trondheim municipality and The Norwegian University of Science and Technology (NTNU)
Cooperation with EU JRC Written a chapter about the taxonomy in the 2022-edition of the European Handbook for SDG Voluntary Local Reviews by the EU JRC.
Using the taxonomy with other means of classificaton Citizen science (CS) can potentially add data to 33% of the SDGs Essay that links the taxonomy and a typology for CS-projects https://theoryandpractice.citizenscie nceassociation.org/articles/10.5334/ cstp.580
From jungle to Zoo? https://theoryandpractice.citizenscienceassociation.org/articles/10.5334/cstp.580 Images composed with AI from Adobe Firefly
Using the taxonomy opens a toolbox to help contextualisedata choosing fit-for-purpose data to help make informed data choices keeping data honest aiding good governance to find data/indicator gaps giving direction to new research
Thank you for your attention! Geir.Graff@asker.kommune.no
Case: National indicators as supplement to the global indicator set TEMPLATE FOR MINISTRIES, DEPARTMENTS AND AGENCIES TO PROVIDE METADATA AND CLASSIFY SUGGESTED INDICATORS J RN KRISTIAN UNDELSTVEDT SPECIAL ADVISER JKU@SSB.NO
Background: National indicators process Report to the Storting (Parliament) in 2021: Action plan for the 2030 Agenda Ministry of Local Government and Regional Development Policy and action points on SDGs and targets Suggested a substantial number of national indicators supplementing the global set
Background: National indicators process Statistics Norway commissioned to manage process of sorting (classifying), narrowing down and disseminate a national indicator set Collaboration with ministries, departments and agencies (Kick-off, WS, seminars) Statistics Norway: Template for metadata and the classification exercise
Template(in Excel): Metadata Indicator (title/name) Distributions Available indicator (title/name) Source (StatBank or other) Target Link to statistics on ssb.no, date for planned next release Geographic coverage Indicator update frequency Unit of measurement Metadata update (YYYY.MM.DD) Definition(s) Explanation
Template (in Excel): Taxonomy exercise Link to taxonomy documents
Template (in Excel): Taxonomy exercise Please fill in below GOAL (1 - 17) X Indicator is relevant for TARGET: X.X QUALITY: - Class (1, 2 or 3) X PERSPECTIVE: Strategic priority: XXXXX Development sector(s): XXXXXX Evaluation: XXXXXXX Distribution(s): XXXXXXXX
Taxonomy application among ministries and agencies Classification information provided for Goal 5-indicators only! Possible reasons: Lack of time or resources Intimidating never done something like this before Not enough instructions or training provided in the project Too complicated


")


: Metadata")
: Taxonomy exercise")
: Taxonomy exercise")