The Divided States of America: A Look at Party Polarization
The images depict the growing party polarization in American politics, showing the widening gap between Republicans and Democrats since the 1980s. The data visualizations illustrate how the ideological divide has evolved over the years, culminating in high levels of animosity and competition between the two major parties. The stark differences in views and perceptions highlight the deepening polarization within the American electorate.
Download Presentation

Please find below an Image/Link to download the presentation.
The content on the website is provided AS IS for your information and personal use only. It may not be sold, licensed, or shared on other websites without obtaining consent from the author. Download presentation by click this link. If you encounter any issues during the download, it is possible that the publisher has removed the file from their server.
E N D
Presentation Transcript
Red or Blue - Which Way Is America Heading? TOM PATTERSON TCCTA FEBRUARY 19, 2021
Nature of Recent Party Politics Party Polarization the ever-widening divide between Republicans and Democrats that began in the 1980s
What the party divide in Congress once looked like 1973-74 Partisan overlap Source: Keith Poole and Howard Rosenthal research (NOMINATE scores)
What the party divide in Congress looks like today` Senators House members Source: Keith Poole and Howard Rosenthal research (NOMINATE scores). Data are from 112th Congress, which ss virtually what it looks like now
Party Polarization Ideological position of median voter Conservative Liberal 1994 2011 2017 Median Democrat Median Republican Source: Derived from Pew Research Center s poll naalysis
Polarization How Americans see those in the other party percentage of respondents How Republicans see Democrats "enemies" 57 "opponents" 43 How Democrats see Republicans "enemies" 41 "opponents" 59 Source: CBS News poll, February, 2021
Nature of Recent Party Politics Intense Party Competition the highly competitive nature of Republican and Democratic Party competition in recent elections
Closely Matched Parties presidency average margin of popular-vote victory in presidential elections 19 16 10 8 8 3 1901-1920 1921-1940 1941-1960 1961-1980 1981-2000 2001-2020
Closely Matched Parties: Average Margin of House Majority Average House Majority (number) 114 105 68 59 45 27 1899-1920 1921-1940 1941-1960 1961-1980 1981-2000 2001-2020
Closely Matched Parties: Average Margin of Senate Majority Average Senate Majority (number) 24 24 20 13 11 4 1899-1920 1921-1940 1941-1960 1961-1980 1981-2000 2001-2020
What History Tells Us about Close Party Competition Dedicated to winning the next election, closely matched parties have focused on damaging the other party: The single most important thing we want to achieve is for President Obama to be a one-term president, said Republican Senate leader Mitch McConnell in 2009. Dead on arrival are the words Democratic House Speaker Nancy Pelosi used in 2019 in response to Trump legislative proposals.
Historically, when one party has been much stronger than the other, they have behaved differently The stronger party has focused on governing. It isn t worried about losing the next election. The weaker party has moved closer to the stronger party and avoided demonizing it in hopes of drawing away enough of its supporters to become competitive. To break out of our crippling polarization, it will likely require one of our parties to become dominant. Is there anything about 2020 election to suggest that might happen?
What 2020 revealed about the Democratic Party
Bidens Victory Restored Democrats Blue Wall Pennsylvania, Michigan, Wisconsin Penetrated Republican hold on southern tier Arizona, Georgia Won comfortably by some indicators Popular vote margin: 81 million to 74 million Electoral vote margin: 306 to 232
But Bidens victory might not foreshadow a period of Democratic dominance Biden s personal history connected him to key voting blocs Catholics went by 4 points to Trump in 2016, by 5 points to Biden in 2020 a 9-point swing in Democrats favor White working-class men - went by 31 points to Trump in 2016, by 23 points in 2020 an 8-point swing in Democrats favor Catholics and white working-class men are large voting blocs in Pennsylvania and Wisconsin, which Biden won narrowly and wouldn t have won if they d voted as they did in 2016. Source: 2020 exit polls, based on 2-party vote only
Another reason Bidens victory might not be predictive it could be argued that, rather than Biden winning, Trump lost vote preference of those saying they were voting "against" a candidate A fourth of all voters said their vote was against a candidate rather than for a candidate they gave Biden a net gain of 8 percentage points - more than twice his margin of victory Trump 31 Biden 69 Source: 2015 and 2020 exit polls, based on 2-party vote only
Another look at Trumps unpopularity and how it helped Biden in 2020 voters with an unfavorable opinion of Donald Trump 18 2016 82 5 2020 95 Voted Republican Voted Democratic
What 2020 revealed about the Republican Party
Republican Victories Projected to lose House seats, Republicans cut into the Democratic majority in the House by fourteen seats. Republicans maintained domination at state level 23 states are Republican controlled 12 have mixed GOP/Democratic control 15 are Democratic controlled
Why state control matters Redistricting after 2020 census Republicans are better positioned to gerrymander House seats GOP in same position after 2010 census and picked up estimated 20 additional seats through gerrymandering In 2012 House races, Republicans lost national popular vote 49-51 percent but won 52 percent of House seats
Why state control matters States enact most of the laws governing ballot access Since 2003, more than 30 states, all but one controlled at the time by Republicans, have enacted Voter ID laws, the strictest of which require a government-issued photo ID, such as a driver s license or passport Since the 2020 election, Republican legislators in 28 states have introduced bills to curtail mail-in and early voting, which they see as helping Democratic candidates Source: Brennan Center for Justice report, Jan 28, 2021.
Republicans Geographical Advantage in Senate Senate is apportioned by state - less populated states tend to be Republican. The 25 least populous states have only 16 percent of US population but have 50 percent of Senate seats Of the 50 Senate seats of 25 least populous states, 32 are held by Republicans
Republicans Geographical Senate Advantage Percentage of popular vote in 2016, 2018, and 2020 Senate races Republican candidate 44 Democratic candidates 56
GOPs geographical advantage extends to presidential elections through electoral college Percentage of two-party presidential vote 54 Democratic nominee 53 53 52 50.2 51 51 49 51 49 49 49.8 48 47 47 46 Democrats have won popular vote in 7 of the last 8 elections Republican nominee 1992 1996 2000 2004 2008 2012 2016 2020
YET Democrats lost three of those elections (2000, 2004, 2016) and nearly lost in 2020 Although Trump lost the national popular vote by 7 million votes, a shift of less than 45,000 votes in three states would have given Trump a second term: Arizona (11 electoral votes), Biden won by 10,500 votes 0.03% Georgia (16 electoral votes), Biden by 11,800 votes 0.02% Wisconsin (10 electoral votes), Biden by 20,700 votes 0.06% Shift would have resulted in a 269-269 electoral vote tie, which would have placed election in the House where the vote would have been by state. House Republicans had a majority in 26 states.
Republicans Problem Demographic Change virtually no population shift favors the Republicans
Youth Vote (ages 18-29) percentage of two-party presidential vote 67 62 63 60 55 Democratic nominee 51 49 Republican nominee 45 40 37 33 38 2000 2004 2008 2012 2016 2020 Source: Exit polls, 2000-2020
Cumulative effect of shift toward Democratic Party among young adults percentage of two party-presidential vote in 2020 43 ages 18-44 57 52 ages 45 & over 48 Trump Biden Source: 2020 exit polls, based on 2-party vote only
Age- Georgia Senate Run-Off Election percentage of vote Warnock, Loeffler vote was virtually identical 37 ages 18-44 63 57 ages 45 & over 43 Perdue Ossoff Source: 2020 exit polls,
The Making of the Last Democratic Majority Presidential vote preference of first-time voters Democratic nominee 71 65 62 38 35 29 Republican nominee 1932 1936 1940
Race, Ethnicity & the Vote BUT White voters have dropped from 77% to 66% of electorate, while Black/Hispanic voters have increased from 19% to 27%. Democratic percentage of two-party vote Black 96 93 91 91 70 89 88 67 Hispanic 71 68 64 55 44 44 42 41 41 40 White, non-Hispanic 2000 2004 2008 2012 2016 2020 Source: Exit polls, 2000-2020 for vote percentages. Census Bureau data for percentage of electorate.
Asian Asian- -American Vote American Vote percentage of two-party presidential vote Democratic nominee 73 70 65 60 65 57 56 53 47 44 43 35 40 35 30 Republican nominee 27 1992 1996 2000 2004 2008 2012 2016 2020 Source: Exit polls, 1992-2020
Vote of college educated Percentage of two-party presidential vote 55 57 53 53 51 51 49 47 As percentage of voting electorate, college educated have been gradually increasing whereas non-college educated (who tend to vote Republican) have been decreasing 49 47 43 46 2000 2004 2008 2012 Republican 2016 2020 Democratic Source: 2000-2020 exit polls, based on 2-party vote only
Democratic advantage from secular trend percentage of adults 24 20 20 White evangelicals/born again 12 14 6 religious nones 1999 2009 2019 Source: Estimates derived from multiple sources.
2020 Presidential Vote by Religious Orientation percentage of respondents 76 white born again/evangelical 24 38 white no religion 62 Trump Biden Source: 2020 exit polls
Another advantage for Democrats- positioning of the two parties percentage-point difference 45 Republicans distance from independents 35 31 27 27 24 25 23 28 14 20 18 7 16 4 12 3 10 Democrats distance from independents Same-sex marriage Taxes Defense spending Health Care Abortion Climate change Border wall NATO Student debt Source: Compiled by author from multiple recent polls. Percentages are the difference between the average opinion of independents and the average opinion of Republicans and of Democrats.
Why positioning matters in a 2-party system Independents hold balance of power Democrats were 38 percent of voters, Republicans 36 percent, Independents 26 percent percentage of respondents 4 Republicans 96 57 Independents 43 96 Democrats 4 voted for Biden voted for Trump
A Looming Risk for GOP a growing factional divide Who should lead the Republican Party? (percentage of Republicans/independent-leaning-Republicans) Someone else 39 Donald Trump 61 0 10 20 30 40 50 60 70 Source: Gallup poll, February 2021
A disastrous possibility for Republicans break-up into two parties If Donald Trump started a new party, would you join it? (percentage of Republican respondents) Yes 33 Maybe 37 No 30 Source: CBS News poll, February, 2021
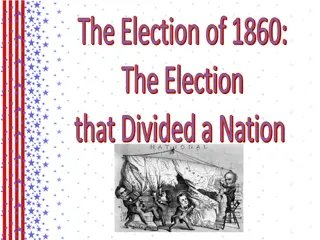
Historically, breakups have been disastrous for the party 1860 Democrats split between Douglas and Breckenridge enabling Republican (Lincoln) to win presidency with 40 percent of vote. Democrats also lost 39 House/8 Senate seats 1912 Republicans split between Taft and Roosevelt enabling Democrat (Wilson) to win with 42 percent of vote. Republicans also lost 29 House/7 Senate seats 2024 If Republicans split, Democrats would sweep election
Republican Safety Valve? Primary Elections: Since 1912, primary elections have allowed party factions to fight it out within the party, as opposed to breaking from the party 2022 two dozen Republican House and Senate races already appear likely to pit establishment Republican incumbents against Trump Republican challengers The Risk: Some of the Republican nominees might be too bizarre or extreme to win general election, as happened in 2010 Senate races in Nevada, Colorado, and Delaware.
The Cost of Factionalism Republican Slippage in Since November percentage expressing favorable opinion Democratic Party 48 45 43 Republican Party 37 Nov, 2020 Feb, 2021 Source: Gallup Polls
Trend in GOPs favorability resembles that when Nixon resigned as president in 1973 By 1974, Gallup poll found that on 24 per cent of respondents identified themselves as Republicans - the lowest level to that point in history of Gallup poll. 1974 midterm elections: Democrats gained 4 Senate seats and 49 House seats. Political scientist Carll Everett Ladd said America now had a party and a half system. Could 2022 be a repeat?
What could go wrong for Democrats? 1. A failed economic recovery from COVID- 19 Historically, a bad economy has been electorally harmful to in-party
In-Party Losses in House Races since World War II number of seats lost on average Other elections 23 Economic recession elections 40
What could go wrong for Democrats? 2. Loss of its positioning advantage a. An increase in belief that Democrats are too liberal ( socialists ) could erode the party s advantage with independents. Perception of Democrats as too liberal may have fueled late swing toward Trump in 2020. It was his closing argument, and he won nearly three-fifths of late deciding voters. Can Democrats establish themselves, in fact and in voters minds, as a moderate party?
Image of Democratic Party Overall, would you describe the views and policies of Democratic Party -- too extreme or generally mainstream? 72 Generally mainstream 58 28 Too extreme 42 2020 2000 Source: Gallup poll, 2000, 2020
