MBA Program Assessment and Causal Model Analysis: Insights and Integration
Delve into the assessment value chain of the 2021-2022 MBA Report, exploring inputs, outcomes, impacts, and outputs to measure student learning outcomes and satisfaction. Analyze the causal model relationships affecting student satisfaction with learning, aiming to enhance outcomes and impacts for improved test scores and curriculum effectiveness.

Download Presentation

Please find below an Image/Link to download the presentation.
The content on the website is provided AS IS for your information and personal use only. It may not be sold, licensed, or shared on other websites without obtaining consent from the author. Download presentation by click this link. If you encounter any issues during the download, it is possible that the publisher has removed the file from their server.
E N D
Presentation Transcript
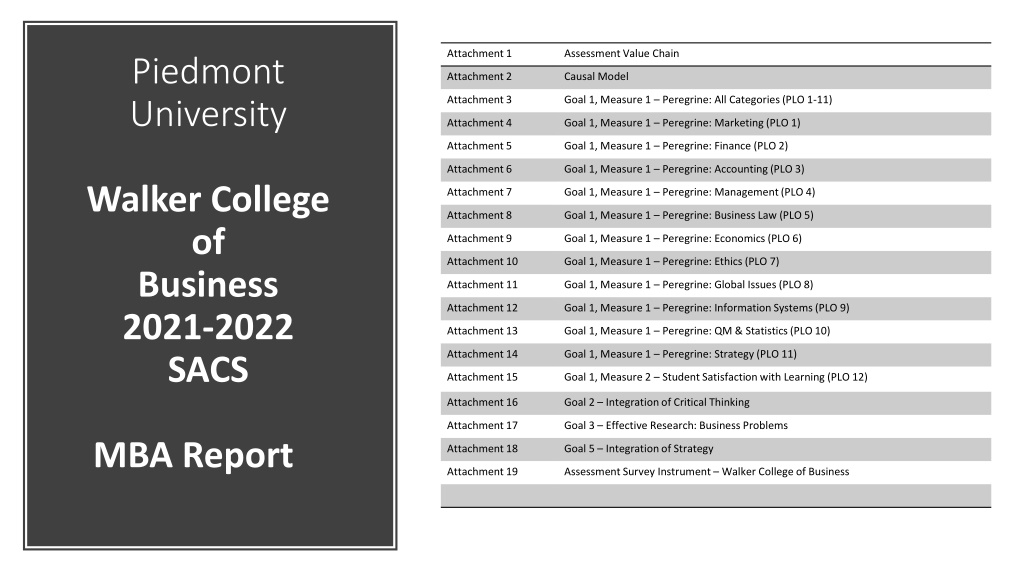
Attachment 1 Assessment Value Chain Piedmont University Attachment 2 Causal Model Attachment 3 Goal 1, Measure 1 Peregrine: All Categories (PLO 1-11) Attachment 4 Goal 1, Measure 1 Peregrine: Marketing (PLO 1) Attachment 5 Goal 1, Measure 1 Peregrine: Finance (PLO 2) Attachment 6 Goal 1, Measure 1 Peregrine: Accounting (PLO 3) Walker College of Business 2021-2022 SACS Attachment 7 Goal 1, Measure 1 Peregrine: Management (PLO 4) Attachment 8 Goal 1, Measure 1 Peregrine: Business Law (PLO 5) Attachment 9 Goal 1, Measure 1 Peregrine: Economics (PLO 6) Attachment 10 Goal 1, Measure 1 Peregrine: Ethics (PLO 7) Attachment 11 Goal 1, Measure 1 Peregrine: Global Issues (PLO 8) Attachment 12 Goal 1, Measure 1 Peregrine: Information Systems (PLO 9) Attachment 13 Goal 1, Measure 1 Peregrine: QM & Statistics (PLO 10) Attachment 14 Goal 1, Measure 1 Peregrine: Strategy (PLO 11) Attachment 15 Goal 1, Measure 2 Student Satisfaction with Learning (PLO 12) Attachment 16 Goal 2 Integration of Critical Thinking Attachment 17 Goal 3 Effective Research: Business Problems MBA Report Attachment 18 Goal 5 Integration of Strategy Attachment 19 Assessment Survey Instrument Walker College of Business
Assessment Value Chain 2021-2022 MBA Report Attachment 1 Inputs (Activities) Outcomes (measured) Impacts Outputs Goal # 1 Student Learning Outcomes Curriculum design Faculty credentials ACBSPFigure 6.5 CPC Plan Courses taught (contact hours) DQ-PQ results Goal integration into Table 7 plan Assessed goals Student satisfaction Student engagement 1 thru 12 10 YearAlumni Survey on Curriculum Attachment 1 depicts the causal model showing the relationship between causal variables, moderator variables, and the outcome variable student satisfaction with learning (SSL). By adjusting (through the use of action plans) the causal and moderating variables we produce the outcome variable SSL which in turn produces the desired impact increased scores on the external Peregrine test. .801* * Pearson Bivariate Correlation Causal Factors Outcome (SSL) Impact (SLO) Moderators 2
2021-2022 MBA Report Attachment 2 AY 2021-2022 MBA Program ACBSP CPC Program Planned Contact Hours Direct and Integrated Topic Hours are Broken Out Functional Areas of Business The Business Environment Technical Skills Program Goals Intergative Areas Integra ted Hours I 12.5 11.4 10.2 16. 15. 16.2 17. 17.5 11.5 12. 15.1 17.5 171.9 Critical thinkin g I . 2.4 8.8 3.5 4. . 9. 5. 3.5 5.3 3. 3.5 47.9 i INFO SYS j QT & STATS k & l STRATEGY CAPSTONE Direct Hours D 35. 35. 35. 35. 35. 35. 35. 35. 35. 35. 35. 35. 420. n COMM I 2. 1.7 1.5 3.5 4. 2.2 3. . 5.5 2. 3.2 5.5 34.1 a MKT b FIN c ACC d MGT e LAW f ECON g ETHICS h GLOBAL D . . . . I . . . . . . . D I . . . . . . . . . . D . . I D . . . . . . I . D . . . . . . . . . . . . . I . . . D . . . . . 35. . . . . . . 35. I . . . . . . . . . . . . . D . . . 35. . . . . . . . . 35. 10.8 45.8 I . . . . D . . . . . . . . . . . . . I D . . . . . . . . . . . . . I . . . . . . . . . . D . . . . . . . I . . . . D . . . . . . . . . . 35. 35. 70. I . . . . 35. 35. . . . . . . . . . . 70. 7. 3.8 . . . . . . . . . .5 11.3 105. 16. 46.3 3.5 . . 1. . 14. 2. . . . 2.2 .5 23.2 23.2 3.5 . 7. . . . 5. . . . .5 35. . . . . . . . . . 35. 1. . . . . . 3.8 . 1. 5.8 35. . . . . . . . 35. 2. . 3. .5 2.5 .8 . 2. 3. . . . . .3 1. .5 4.8 2. . . . . . 1. 2.5 5.5 35. . 35. 35. . . 7. . . . .5 7.5 35. . . . . 35. 3.7 .5 4.2 2. . 2. 42.5 74.2 121. 5.8 35. 2. 39.8 75.5 The ACBSP standard syllabi containing the base data for each course shown above as noted in review date is scheduled for a complete redevelopment by the faculty during August 2017. A completely new roll up is only performed every three years. This update is more important than usual because we have added Data Science to the Undergraduate Business Program and this will change many of the courses. Course credit hours and program length both meet or exceed institution requirements for credit hours per course and credit hours per degree. Piedmont University Faculty and Academic Policies and Procedures, Section 4.1.A
2021-2022 MBA Report Peregrine Data: Marketing SACS: Goal 1, Measure 1, PLO 1 ACBSP: Figure 6.5: a. Attachment 4 Peregrine Data: All SACS: Goal 1, Measure 1, All PLO's ACBSP: Figure 6.5 Attachment 3 70 70 60 60 National Percentile 50 National Percentile 50 40 40 30 30 20 20 10 10 0 0 CPC17-18 CPC18-19 CPC19-20 CPC20-21 CPC21-22 CPC17-18 CPC18-19 CPC19-20 CPC20-21 CPC21-22 Data Pt 50 51 58 70 52 Data Pt 58 55 65 76 62 5 Year Average: 63rd Percentile 5 Year Average: 56th Percentile
2021-2022 MBA Report Peregrine Data: Accounting SACS: Goal 1, Measure 1, PLO 3 ACBSP: Figure 6.5: c. Attachment 6 Peregrine Data: Finance SACS: Goal 1, Measure 1, PLO 2 ACBSP: Figure 6.5: b. Attachment 5 70 70 60 60 National Percentile National Percentile 50 50 40 40 30 30 20 20 10 10 0 0 CPC17-18 CPC18-19 CPC19-20 CPC20-21 CPC21-22 CPC17-18 CPC18-19 CPC 19-20 CPC20-21 CPC21-22 Data Pt 44 50 47 73 36 Data Pt 56 50 57 68 47 5 Year Average: 50th Percentile 5 Year Average: 56th Percentile
2021-2022 MBA Report Peregrine Data: Management SACS: Goal 1, Measure 1, PLO 4 ACBSP: Figure 6.5: d. Attachment 7 Peregrine Data: Business Law SACS: Goal 1, Measure 1, PLO 5 ACBSP: Figure 6.5: e. Attachment 8 70 70 60 60 National Percentile National Percentile 50 50 40 40 30 30 20 20 10 10 0 0 CPC17-18 CPC18-19 CPC19-20 CPC20-21 CPC21-22 CPC17-18 CPC18-19 CPC19-20 CPC 20-21 CPC21-22 Data Pt 48 54 55 64 37 Data Pt 52 54 58 68 62 5 Year Average: 52nd Percentile 5 Year Average: 59th Percentile
2021-2022 MBA Report Peregrine Data: Ethics SACS: Goal 1, Measure 1, PLO 7 ACBSP: Figure 6.5: g. Attachment 10 Peregrine Data: Economics SACS: Goal 1, Measure 1, PLO 6 ACBSP: Figure 6.5: f. Attachment 9 70 70 60 60 National Percentile National Percentile 50 50 40 40 30 30 20 20 10 10 0 CPC17-18 CPC18-19 CPC19-20 CPC20-21 CPC21-22 0 CPC17-18 CPC18-19 CPC19-20 CPC20-21 CPC21-22 Data Pt 52 55 59 81 61 Data Pt 46 41 59 74 56 5 Year Average: 62nd Percentile 5 Year Average: 55th Percentile
2021-2022 MBA Report Peregrine Data: Global Issues SACS: Goal 1, Measure 1, PLO 8 ACBSP: Figure 6.5: h. Attachment 11 Peregrine Data: Information Systems SACS: Goal 1, Measure 1, PLO 9 ACBSP: Figure 6.5: i. Attachment 12 70 70 60 60 National Percentile National Percentile 50 50 40 40 30 30 20 20 10 10 0 0 CPC17-18 CPC18-19 CPC19-20 CPC20-21 CPC21-22 CPC17-18 CPC18-19 CPC19-20 CPC20-21 CPC21-22 Data Pt 50 48 63 68 47 Data Pt 49 51 57 57 47 5 Year Average: 55th Percentile 5 Year Average: 52nd Pecentile
2021-2022 MBA Report Peregrine Data: QM & Stats SACS: Goal 1, Measure 1, PLO 10 ACBSP: Figure 6.5: j. Attachment 13 Peregrine Data: Strategy SACS: Goal 1, Measure 1, PLO 11 ACBSP: Figure 6.5: k. Attachment 14 70 70 National Percentile 60 National Percentile 60 50 50 40 40 30 30 20 20 10 10 0 0 CPC17-18 CPC18-19 CPC19-20 CPC20-21 CPC21-22 CPC17-18 CPC18-19 CPC19-20 CPC20-21 CPC21-22 Data Pt 41 42 51 59 43 Data Pt 50 51 64 62 52 5 Year Average: 47th Percentile 5 Year Average: 56th Percentile
2021-2022 MBA Report MBA Student Satisfaction w/Learning Goal 1, Measure 2, PLO 12 Attachment 15 4.88 4.78 5.00 4.72 4.71 4.50 4.50 4.00 3.50 3.00 2.50 2.00 1.50 1.00 AY 2017-2018 AY 2018-2019 AY 2019-2020 AY 2020-2021 2021-2022 5 Year Average: 4.72
2021-2022 MBA Report MBA Causal Factor, Goal 3, Measure 1: Effective Research: Business Problems Attachment 17 MBA Causal Factor, Goal 2, Measure 1: Integration of Critical Thinking Attachment 16 5.0 5.0 4.5 4.5 4.0 4.0 3.5 3.5 AY 20-21 AY 21-22 AY 22-23 AY 23-24 AY 24-25 AY 17-18 AY 18-19 AY 19-20 AY 20-21 AY 21-22 OWC 4.39 4.44 Crit-Think 4.65 4.69 4.78 4.50 4.75 5 Year Average: 4.67
2021-2022 MBA Report MBA Causal Factor, Goal 5, Measure 1 Integration of Strategy Attachment 18 5.0 4.5 4.0 3.5 AY 17-18 AY 18-19 AY 19-20 AY 20-21 AY 21-22 Strategy 4.60 4.89 4.86 4.40 4.35 5 Year Average: 4.62
2021-2022 MBA Report Attachment 19