Understanding 2-Sample t-Test Examples
The 2-sample t-test is used to determine if mean scores differ between two groups in various scenarios, such as comparing test scores in different sections, yew density in moose browsing areas, or headache pain relief with different treatments. Key steps include formulating hypotheses, calculating test statistics, checking assumptions, and interpreting results. In case of unequal variances, Levene's test is performed to assess homogeneity. An example involving caffeine's effect on muscle metabolism further illustrates the application of the 2-sample t-test.

Download Presentation

Please find below an Image/Link to download the presentation.
The content on the website is provided AS IS for your information and personal use only. It may not be sold, licensed, or shared on other websites without obtaining consent from the author. Download presentation by click this link. If you encounter any issues during the download, it is possible that the publisher has removed the file from their server.
E N D
Presentation Transcript
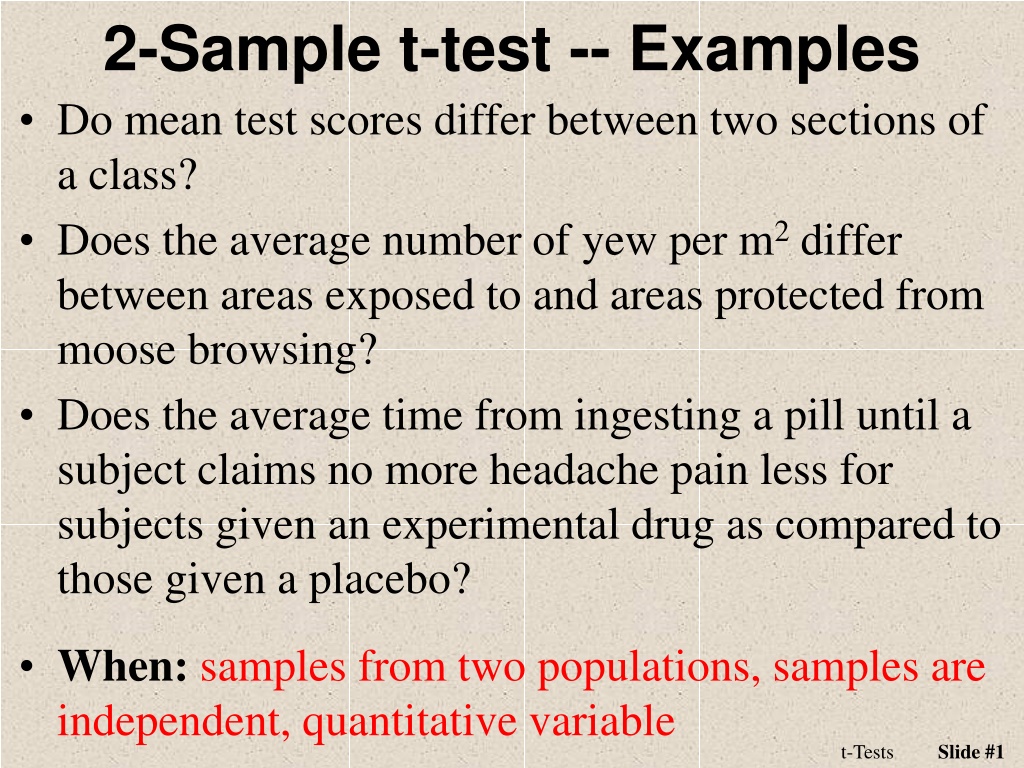
2-Sample t-test -- Examples Do mean test scores differ between two sections of a class? Does the average number of yew per m2 differ between areas exposed to and areas protected from moose browsing? Does the average time from ingesting a pill until a subject claims no more headache pain less for subjects given an experimental drug as compared to those given a placebo? When: samples from two populations, samples are independent, quantitative variable Slide #1 t-Tests
2-sample t-test Ho: 1- 2=0 (which is the same as = 2) x x Statistic: ( t = 1 2 ) - 0 1 2 p s x x 2 Test Statistic: SE 1x x 2 1 1 + n n 1 2 where sp2 is the pooled sample variance ( ) s 1 ( ) s 1 2 1 + 2 2 + n n 2 p 1 2 = s n n 2 1 2 df = n1 + n2 - 2 Slide #2 t-Tests
2-sample t-test Assume: n1 + n2 is large (to use a t-distribution) n1 + n2 > 40, OR n1 + n2 > 15 and both histograms are not strongly skewed, OR both histograms are approximately normal the two samples are independent 12 = 22 Are 12 & 22 parameters or statistics? Hypothesis Test -- Levene s Test Ho: 12 = 22 vs Ha: 12 22 What do you do with the p-value? Slide #3 t-Tests
Levenes Test Summary A hypothesis test within a hypothesis test. Small p-values mean the variances are unequal. If Levene s test is a reject, can not continue with the 2-sample t-test (as presented here). Slide #4 t-Tests
A Full Example A study of the effect of caffeine on muscle metabolism used 36 male volunteers who each underwent arm exercise tests. Eighteen of the men were randomly selected to take a capsule containing pure caffeine one hour before the test. The other men received a placebo capsule. During each exercise the subject's respiratory exchange ratio (RER) was measured. [RER is the ratio of CO2 produced to O2 consumed and is an indicator of whether energy is being obtained from carbohydrates or fats]. The question of interest to the experimenter was whether, on average and at the 5% level, caffeine changed mean RER. Slide #5 t-Tests
A Full Example Group n Mean StDev Min 1st Qu Median 3rd Qu Max Caffeine 18 94.22 4.870 84.0 93.00 94.00 96.75 105.0 Placebo 18 100.10 5.795 89.0 96.25 100.50 103.00 109.0 Levene s Test p-value = 0.1993 Caffeine Placebo 6 6 Frequency Frequency 4 4 2 2 0 0 80 85 90 95 100 85 90 95 100 110 105 105 RER RER Slide #6 t-Tests
Recipe for any Hypothesis Test 1) State the rejection criterion ( ) =0.05 2) State the null & alternative hypotheses, define the parameter(s) Ho: c p = 0 Ha: c p 0 where c is mean RER for all males given the caffeine pill p is mean RER for all males given the placebo Slide #7 Inference Concepts
Recipe for any Hypothesis Test 3) Determine which test to perform Explain! 2-sample t-test because (a) two populations were considered (caffeine and placebo groups), (b) the populations are independent (there is no connection between males in the two groups), and (c) a quantitative variable (RER) was recorded. 4) Collect the data (address type of study and randomization) (i) Experiment (pill was controlled by experimenter to form treatments) (ii) Random allocation of individuals to treatments, but not random selection from population for inclusion in the experiment Slide #8 Inference Concepts
Recipe for any Hypothesis Test 5) Check all necessary assumption(s) (i) nc+np = 18+18 = 36 >15 and histograms not strongly skewed Caffeine Placebo 6 6 Frequency Frequency 4 4 2 2 0 0 80 85 90 95 100 85 90 95 100 110 105 105 RER RER (ii) Two samples are independent Slide #9 Inference Concepts
Recipe for any Hypothesis Test 5) Check all necessary assumption(s) [cont] (iii) Variances are equal 2. Ho: Variances are equal Ha: Variances are not equal 3. Levene s Test 8. p-value = 0.1993 9. p-value > (0.05) DNR Ho 10. Variances appear to be equal Slide #10 Inference Concepts
Group n Mean StDev Min 1st Qu Median 3rd Qu Max Caffeine 18 94.22 4.870 84.0 93.00 94.00 96.75 105.0 Placebo 18 100.10 5.795 89.0 96.25 100.50 103.00 109.0 6) Calculate the appropriate statistic(s) xc - xp = 94.22-100.10 = -5.88 ( ) ( 2 n n 2 1 + ) s ( ) ( ) + 2 1 2 2 + 2 2 n 1 s n 1 18 1 4.870 1 8 1 5.795 = 28 . 4356 = 2 p = 1 2 s + 1 8 1 8 2 1 1 1 1 . 1 = 778 = + 2 p = + SE s 28.4356 x x n n 18 18 c p 1 2 7) Calculate the appropriate test statistic ( p c SE ) 0 - 5.88 x x 0 - = = . 3 = 307 t . 1 778 x c x p df = 18 + 18 2 = 34 Slide #11 t-Tests
Recipe for any Hypothesis Test 8) Calculate the p-value > 2*distrib(-3.307,distrib="t",df=34) [1] 0.002233631 9) State your rejection decision p-value (0.0022) < (0.05) . Reject Ho 10) Summarize your findings in terms of the problem The mean RER appears to differ between the males that received the caffeine pill and those that received the placebo. Slide #12 Inference Concepts
Recipe for any Hypothesis Test 11) If rejected H0, compute a 100(1- )%confidence region for parameter (i) 100(1-0.05)% = 95% (ii) Interval because Ha was not equals (iii) t* = 2.032 from > ( distrib(0.025,distrib="t",df=34,type="q") ) [1] -2.032245 (iv) -5.88 2.032*1.778 -5.88 3.61 (-9.49, -2.27) (v) I am 95% confident that the mean RER for those that received the caffeine pill is between 2.27 and 9.49 units lower than for those that received the placebo. Slide #13 Inference Concepts