Predicting Support for the President: Newspaper Poll Comparison
Comparison of four nationwide newspaper polls in Zedland to predict support for the President in the upcoming election. Analyzing sample sizes, polling dates, and percentages reported by each newspaper to determine the most reliable predictor for the election on January 25.

Download Presentation

Please find below an Image/Link to download the presentation.
The content on the website is provided AS IS for your information and personal use only. It may not be sold, licensed, or shared on other websites without obtaining consent from the author. Download presentation by click this link. If you encounter any issues during the download, it is possible that the publisher has removed the file from their server.
E N D
Presentation Transcript
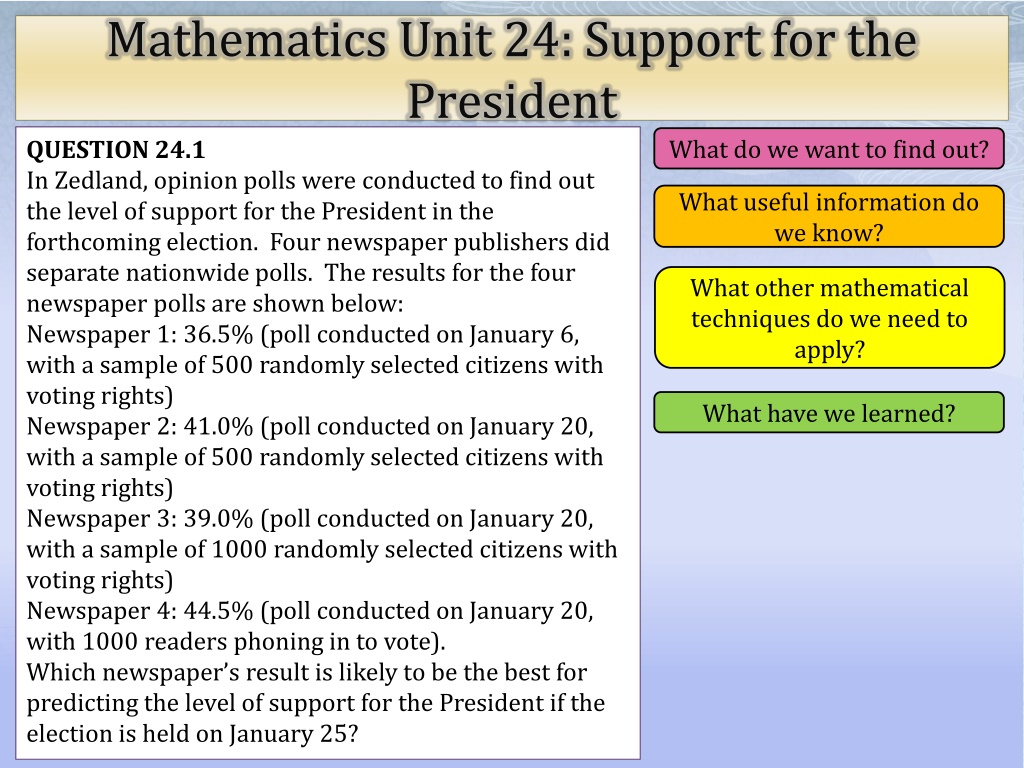
Mathematics Unit 24: Support for the President QUESTION 24.1 In Zedland, opinion polls were conducted to find out the level of support for the President in the forthcoming election. Four newspaper publishers did separate nationwide polls. The results for the four newspaper polls are shown below: Newspaper 1: 36.5% (poll conducted on January 6, with a sample of 500 randomly selected citizens with voting rights) Newspaper 2: 41.0% (poll conducted on January 20, with a sample of 500 randomly selected citizens with voting rights) Newspaper 3: 39.0% (poll conducted on January 20, with a sample of 1000 randomly selected citizens with voting rights) Newspaper 4: 44.5% (poll conducted on January 20, with 1000 readers phoning in to vote). Which newspaper s result is likely to be the best for predicting the level of support for the President if the election is held on January 25? What do we want to find out? What do we want to find out? What useful information do we know? What useful information do we know? What other mathematical techniques do we need to apply? What other mathematical techniques do we need to apply? What have we learned? What have we learned?
Mathematics Unit 24: Support for the President QUESTION 24.1 In Zedland, opinion polls were conducted to find out the level of support for the President in the forthcoming election. Four newspaper publishers did separate nationwide polls. The results for the four newspaper polls are shown below: Newspaper 1: 36.5% (poll conducted on January 6, with a sample of 500 randomly selected citizens with voting rights) Newspaper 2: 41.0% (poll conducted on January 20, with a sample of 500 randomly selected citizens with voting rights) Newspaper 3: 39.0% (poll conducted on January 20, with a sample of 1000 randomly selected citizens with voting rights) Newspaper 4: 44.5% (poll conducted on January 20, with 1000 readers phoning in to vote). Which newspaper s result is likely to be the best for predicting the level of support for the President if the election is held on January 25? What do we want to find out? What useful information do we know? What useful information do we know? What other mathematical techniques do we need to apply? What other mathematical techniques do we need to apply? What have we learned? What have we learned? Back to start Back to start
Mathematics Unit 24: Support for the President QUESTION 24.1 In Zedland, opinion polls were conducted to find out the level of support for the President in the forthcoming election. Four newspaper publishers did separate nationwide polls. The results for the four newspaper polls are shown below: Newspaper 1: 36.5% (poll conducted on January 6, with a sample of 500 randomly selected citizens with voting rights) Newspaper 2: 41.0% (poll conducted on January 20, with a sample of 500 randomly selected citizens with voting rights) Newspaper 3: 39.0% (poll conducted on January 20, with a sample of 1000 randomly selected citizens with voting rights) Newspaper 4: 44.5% (poll conducted on January 20, with 1000 readers phoning in to vote). Which newspaper s result is likely to be the best for predicting the level of support for the President if the election is held on January 25? What do we want to find out? What do we want to find out? What useful information do we know? What other mathematical techniques do we need to apply? What other mathematical techniques do we need to apply? What have we learned? What have we learned? Back to start Back to start
Mathematics Unit 24: Support for the President QUESTION 24.1 In Zedland, opinion polls were conducted to find out the level of support for the President in the forthcoming election. Four newspaper publishers did separate nationwide polls. The results for the four newspaper polls are shown below: Newspaper 1: 36.5% (poll conducted on January 6, with a sample of 500 randomly selected citizens with voting rights) Newspaper 2: 41.0% (poll conducted on January 20, with a sample of 500 randomly selected citizens with voting rights) Newspaper 3: 39.0% (poll conducted on January 20, with a sample of 1000 randomly selected citizens with voting rights) Newspaper 4: 44.5% (poll conducted on January 20, with 1000 readers phoning in to vote). Which newspaper s result is likely to be the best for predicting the level of support for the President if the election is held on January 25? What do we want to find out? What do we want to find out? What useful information do we know? What useful information do we know? What other mathematical techniques do we need to apply? What have we learned? What have we learned? Back to start Back to start
Mathematics Unit 24: Support for the President QUESTION 24.1 In Zedland, opinion polls were conducted to find out the level of support for the President in the forthcoming election. Four newspaper publishers did separate nationwide polls. The results for the four newspaper polls are shown below: Newspaper 1: 36.5% (poll conducted on January 6, with a sample of 500 randomly selected citizens with voting rights) Newspaper 2: 41.0% (poll conducted on January 20, with a sample of 500 randomly selected citizens with voting rights) Newspaper 3: 39.0% (poll conducted on January 20, with a sample of 1000 randomly selected citizens with voting rights) Newspaper 4: 44.5% (poll conducted on January 20, with 1000 readers phoning in to vote). Which newspaper s result is likely to be the best for predicting the level of support for the President if the election is held on January 25? What do we want to find out? What do we want to find out? What useful information do we know? What useful information do we know? What other mathematical techniques do we need to apply? What other mathematical techniques do we need to apply? What have we learned? Back to start Back to start