Understanding Information Systems from an Accountant's Perspective
Information is organized data that improves decision-making. Data collection is crucial for businesses to track activities, resources, and participants. Quality information is relevant, timely, accurate, complete, and summarized according to user needs. Feedback is essential for improving processes. As information flows upwards in organizations, it becomes more summarized.

Download Presentation

Please find below an Image/Link to download the presentation.
The content on the website is provided AS IS for your information and personal use only. It may not be sold, licensed, or shared on other websites without obtaining consent from the author. Download presentation by click this link. If you encounter any issues during the download, it is possible that the publisher has removed the file from their server.
E N D
Presentation Transcript
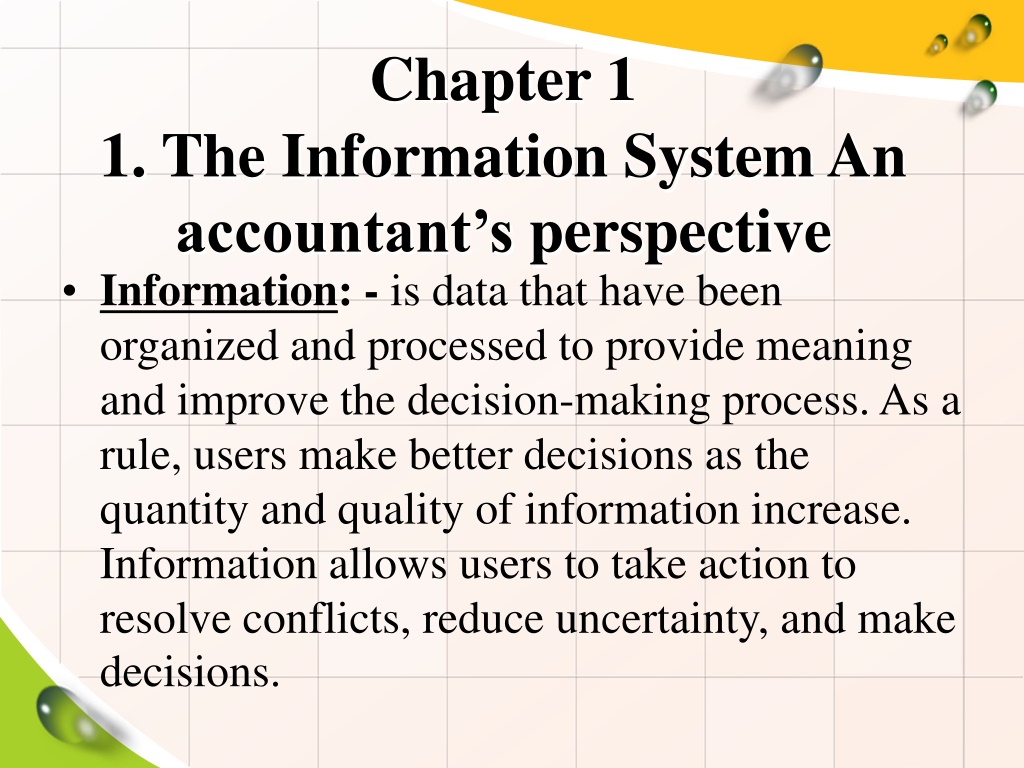
Chapter 1 1. The Information System An accountant s perspective Information: - is data that have been organized and processed to provide meaning and improve the decision-making process. As a rule, users make better decisions as the quantity and quality of information increase. Information allows users to take action to resolve conflicts, reduce uncertainty, and make decisions.
Data:-are facts that are collected, recorded, stored, and processed by an information system. Businesses need to collect several kinds of data, such as the activities that take place, the resources affected by the activities, and the people who participate in the activity. For example, the business needs to collect data about a sale (date, total amount), the resource sold (good or service, quantity sold, unit price), and the people who salesperson). participated (customer,
Quality of Information Regardless of physical form, useful information has the following characteristics: Relevance- The contents of a report or document must serve a purpose. Reports containing irrelevancies waste resources and may be counterproductive to the user. Irrelevancies detract attention from the true message of the report and may result in incorrect decisions or actions.
Timeliness- The age of information is a critical factor in determining its usefulness. Information must be no older than the time period of the action it supports. For example, if a manager makes decisions daily to purchase inventory from a supplier based on an inventory status report, then the information in the report should be no more than a day old.
Accuracy- Information must be free from material errors. Completeness- No piece of information essential to a decision or task should be missing.
Summarization- Information should be aggregate/ comprehensive in accordance with the user s needs. Lower-level managers tend to need information that is highly detailed. As information flows upward through the organization to top management, it becomes more summarized
Feedback- is a form of output that is sent back to the system as a source of data. Feedback may be internal or external and is used to initiate or alter a process.
1.2. The system environment Elements of a System- A system is a group of two or more interrelated components or subsystems that interact to serve a common purpose. Multiple Components Relatedness System versus Subsystem Purpose
1.5. The Evolution of Information System Models The manual process model The Flat-File Model The Database Model The Resources, Events, and Agents (REA) Model Enterprise Resource Planning Systems Accountant s Role in the information system
CHAPTER TWO 2. AN OVERVIEW OF TRANSACTION PROCESSING 2.1. Transaction Cycles 2.2. Expenditure Cycle 2.3. Conversion Cycle 2.4. The Revenue Cycle
Accounting Records Manual Systems Journals Ledgers
CHAPTER 3 MANAGING DATA RESOURCES Data is vital organization resources that need to be managed like other important business assets. File Organization Terms and Concepts
Approaches to File Management Data Base Models Elements of the Database Environment
Chapter Four 4. Introduction to system development life cycle 4.1 Definition of System Development Life Cycle System development systematic process acquiring a new system, design a system, implementation and use of it system. life cycle is a of developing or
System Analysis The information needed to purchase or develop a new system is gathered. Requests for systems development are prioritized to maximally utilize limited development resources
Steps in system analysis Initial Investigation Systems Survey Feasibility study Information needs and system requirements System analysis report
Chapter Five Conceptual Design The company decides how to meet user needs. The first task is to identify and evaluate appropriate design alternatives. Conceptual system design: A general framework is developed for implementing user requirements and solving problems identified in the analysis phase.
4.1.2.1 Evaluate design alternatives There are many ways to design AIS, so the design team must continually make design decisions like: Should the company mail hard copy purchase orders or use EDI? Should the company have a large centralized mainframe and database, or distribute computer power to stores?
Preparing design specification Once a design alternative has been selected, the project team develops the conceptual design specifications for the following elements: Output, Data storage, Input and Processing procedures and operations
4.2 system development planning Each requires a plan, and each phase of each development plan must also be planned. Systems development important step for a number of key reasons: of systems development project planning is an Consistency, Lower costs and Adaptability Efficiency, Cutting edge,
4.3 Behavioral aspects of change Aggression: behaviors that are intended to produce errors with the new system, or weaken the effectiveness of the new system Projection: blame the new system for everything that goes wrong Avoidance: ignore the new system in hopes that it will eventually go away
4.4 Who Is Involved in the SDLC? Information Systems Steering Committee: Executive level, plans and oversees IS function; facilitates coordination with integration of systems activities Project Development Team: Plan and monitor project progress Programmers: Write and test programs according to analysts specifications
Systems Analysts: Determine information needs, prepare specifications for programmers Management: Get users involved in the process, provide support for development projects, align projects to meet organizations strategic needs Users: Communicate needs to system developers, help design and test to ensure complete and accurate processing of data
CHAPTER six: System Development and Documentation Tools & Techniques
Documentation Documentation explains how a system works, including the who, what, when, where, why, and how of: data entry data processing data storage information output system controls
Why Document Systems? Accountants must be able to read documentation and understand how a system works. Accounting Acts requires management to assess internal controls and auditors to evaluate the assessment Used for systems changes development and
It has been said that a picture is worth a thousand words, and that certainly is true when it comes to an easy way to understand an organization s information system. Documenting an information system requires great skill; however, the ability to understand and read a documentation can be quite intuitive. Although there are many methods used in business to document systems, the text uses the three most popular for accountants: data flow diagrams, systems flowcharts, and Business Process Modeling Notation (BPMN).
Documentation Tools Documentation tools are important on the following levels: you must be able to read documentation to determinehowasystemworks. You may need to evaluate documentation to identify internal weaknesses&recommendimprovements. More skill is documentation that shows how an existing orproposedsystemoperates. control strengths & needed to prepare
Documentation Tools There are three common systems documentation tools Data flow diagram (DFD) Flowchart Document flowchart System flowchart Program flowchart Business Process diagrams
Data Flow Diagrams (DFD) Focuses on the data flows for: Processes Sources and destinations of the data Data stores DFD are visually simple, can be used to represent the same process at a high abstract or detailed level. It uses four symbols to represent four basic elements:
Data flow diagram (DFD) There are four basic symbols to the data flow diagram: 1.The square box symbol represents where the data is coming from (source) and where it ends up (destination). An example, from a revenue cycle perspective is that the customer would be a data source. 2. The arrows are symbols showing the directional flow of data from a source to either: a transformative process, data store, or data destination. 3.The circle is a symbol that shows a transformative process. This can be at a high context level such as process Revenue cycle ; or it could be at a more detailed level such as sales order entry 4. The two horizontal lines represent data storage In addition, you may see a triangle used in a DFD which would identify controls associated with the process.
Basic Data Flow Diagram Elements
DFD A data source and a data destination are entities that send or receive data that the system uses or produces. An entity can be both a source and a destination. They are represented by squares.
DFD A data flow is the movement of data among processes, stores, sources, and destinations. Data that pass between data stores and a source or destination must go through a data transformation process. Data flows are labeled to show what data is flowing. If two or more data flows move together, a single line is used. If the data flow separately, two lines are used.
DFD Processes represent the transformation of data. A data store is a repository of data. DFDs do not show the physical storage medium (such as a server or paper) used to store the data. Data stores are represented by horizontal lines, with the name of the file written inside the lines.
Subdividing the DFD DFDs are subdivided into successively lower levels to provide ever-increasing amounts of detail, because few systems can be fully diagrammed on one sheet of paper. Also, users have differing needs, and a variety of levels can better satisfy differing requirements.
Subdividing the DFD The highest-level DFD is referred to as a context diagram because it provides the reader with a summary-level view of a system. It depicts a data processing system & the entities that are destinations of system inputs and outputs. the sources and
Lower - Level DFD Ayele used the narrative description of S&S s payroll processing procedures to decompose the context diagram into successively lower levels, each with more detail. The narrative describes five data processing activities: Updatingtheemployee/payrollmasterfile Handlingemployeecompensation Generatingmanagementreports Payingtaxes Posting entries to the general ledger
Ayele exploded his context diagram and created the Level 0 DFD Notice that some data inputs and outputs have been excluded from this DFD. For example, in process 2.0, the data inflows and outflows that are not related to an external entity or to another process are not depicted (tax tables and payroll register).
Ayele employees) to create a Level 1 DFD. The following figure provides more detail about the data processes involved in paying employees, and it includes the tax rates table and the payroll register data flow omitted from the above figure. exploded process 2.0 (pay
Basic Guidelines for creating a DFD Understand the system that you are trying to represent. A DFD is representation that you need to consider what is relevant and what needs to be included. Start with a high level to show how between outside entities & inside the system. Use additional DFD s at the detailed level to show how data flows system. Identify and group all the basic elements of the DFD. Name data elements with descriptive action verbs for processes (e.g., update, edit, prepare, validate, etc.). Give each sequential number to help the reader navigate from the abstract to the detailed levels. Edit/Review/Refine DFD to make it easy to read and understand. a simple meaning names, use process a data flows your within the
1.Understand the system that you are trying to represent: if you don t understand the system that you are trying to visually represent, no one else will understand what you created. Ways to help you understand are to actually observe the process taking place, interview and ask questions, and try to do a walkthrough of a transaction to understand how the data flows, where it generates from, what activities occur within the process, and who else uses this information. It is also good to identify the source documents used as you may have seen in the chapter. Figure 3-5, for example, identifies the source document on top of the data flow arrow. 2.Only relevant data elements should be included in the data flow diagram.
3. Starting with a level of abstraction, generally drawing a context DFD that shows the data flowing between outside entities (e.g., customer) and inside the organization allows for a simple big picture of the process. Using a hierarchy to drill down into the details (e.g., sales invoice process) can show more information. By creating a hierarchy of levels of detail allows the reader of the DFD to either just get the overall big picture of a process, or really get the details of a process. It would be difficult and messy creating information overload if there was no organization of the DFD making the DFD too cluttered to read.
4. Identify and group the data flows. If for example, the data flows together they are in one arrow, when it separates out then use multiple arrows. An example of this would be a sales order, some orders may be approved and continue to move through the process whereas others may not be approved and would flow back to the customer. Similarly, identify and group transformation processes, data stores, data sources, and destinations. 5. By being descriptive it helps the reader understand the process better. 6. Giving a process a sequential number helps provide an information trail to the reader of the DFD as they move from abstract to detailed versions of the process. 7. As with anything, refining your draft and receiving feedback help provide for a clear understanding as to what you intend the reader will understand from your DFD


")
")